
See also


 09.09.2026 05:54 AM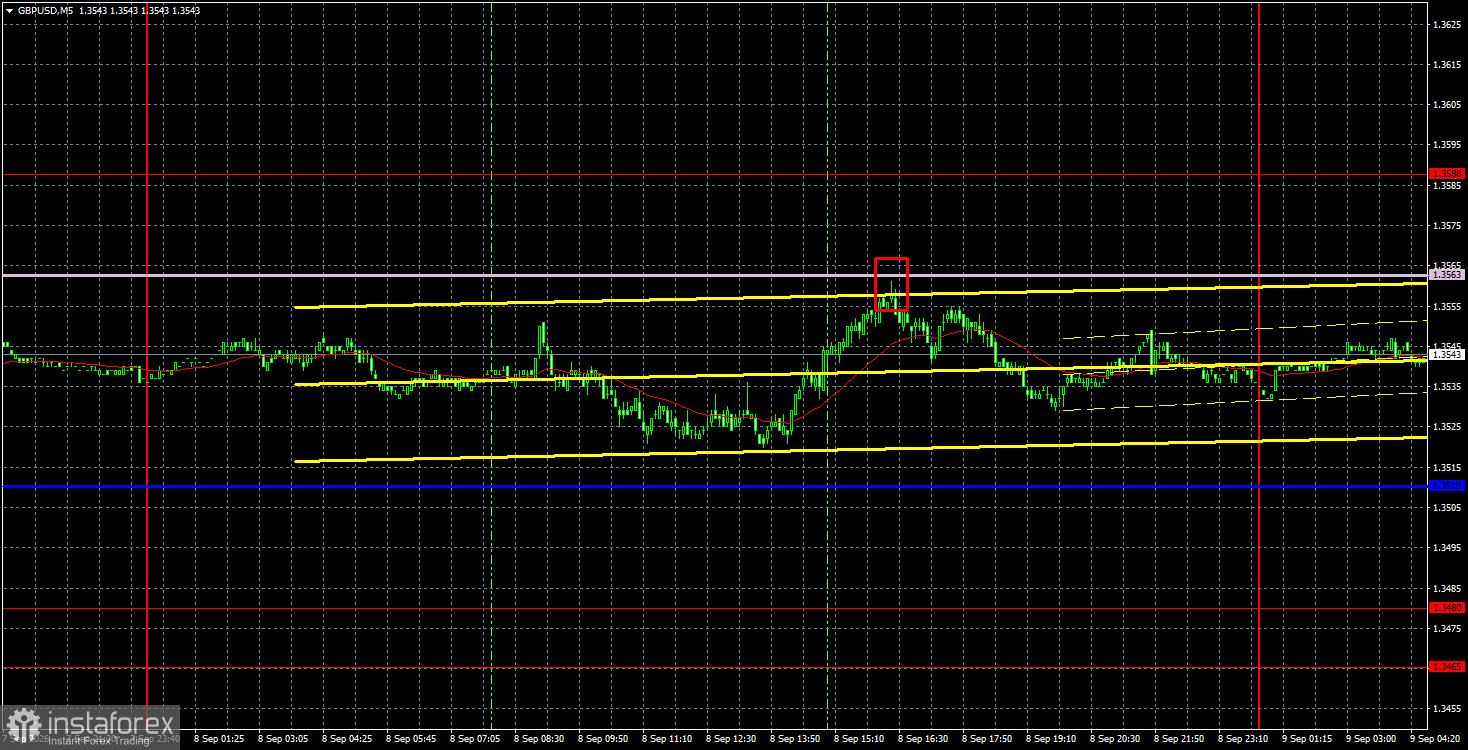
The GBP/USD pair was effectively immobilized for most of Tuesday, with volatility around 40 pips. In essence, there were no meaningful moves in the first two days of the week. The macro backdrop was absent — the market had nothing to react to on Monday or Tuesday. For the third consecutive week, market action is concentrated in one or two headline events per week. Last week the market awaited Nonfarm Payrolls, the week before that the annual Nonfarms, this week the US inflation report, and next week the market will await Bank of England and Federal Reserve meetings. Thus, we would not expect powerful GBP/USD moves today. The market has shown for six weeks that it is not prepared to react to secondary events unrelated to Fed policy or key US macro releases. That said, flat periods or low activity are opportunities to build medium-term positions. When the market stands still, large players are often accumulating positions for the next move, and strong trends often follow extended flats.
Technically, the pound has completed the downtrend as the trendline was broken. In the near term, price may attempt to clear Senkou Span B, the last support for bears. A break above that line would confirm a transition to an uptrend on the hourly timeframe.
On the 5-minute TF on Tuesday, one sell signal formed. Early in the US session, price bounced near Senkou Span B, allowing short positions. Given low volatility, the pair moved down only 15 pips by day end and failed to reach even the nearest target — the critical line.
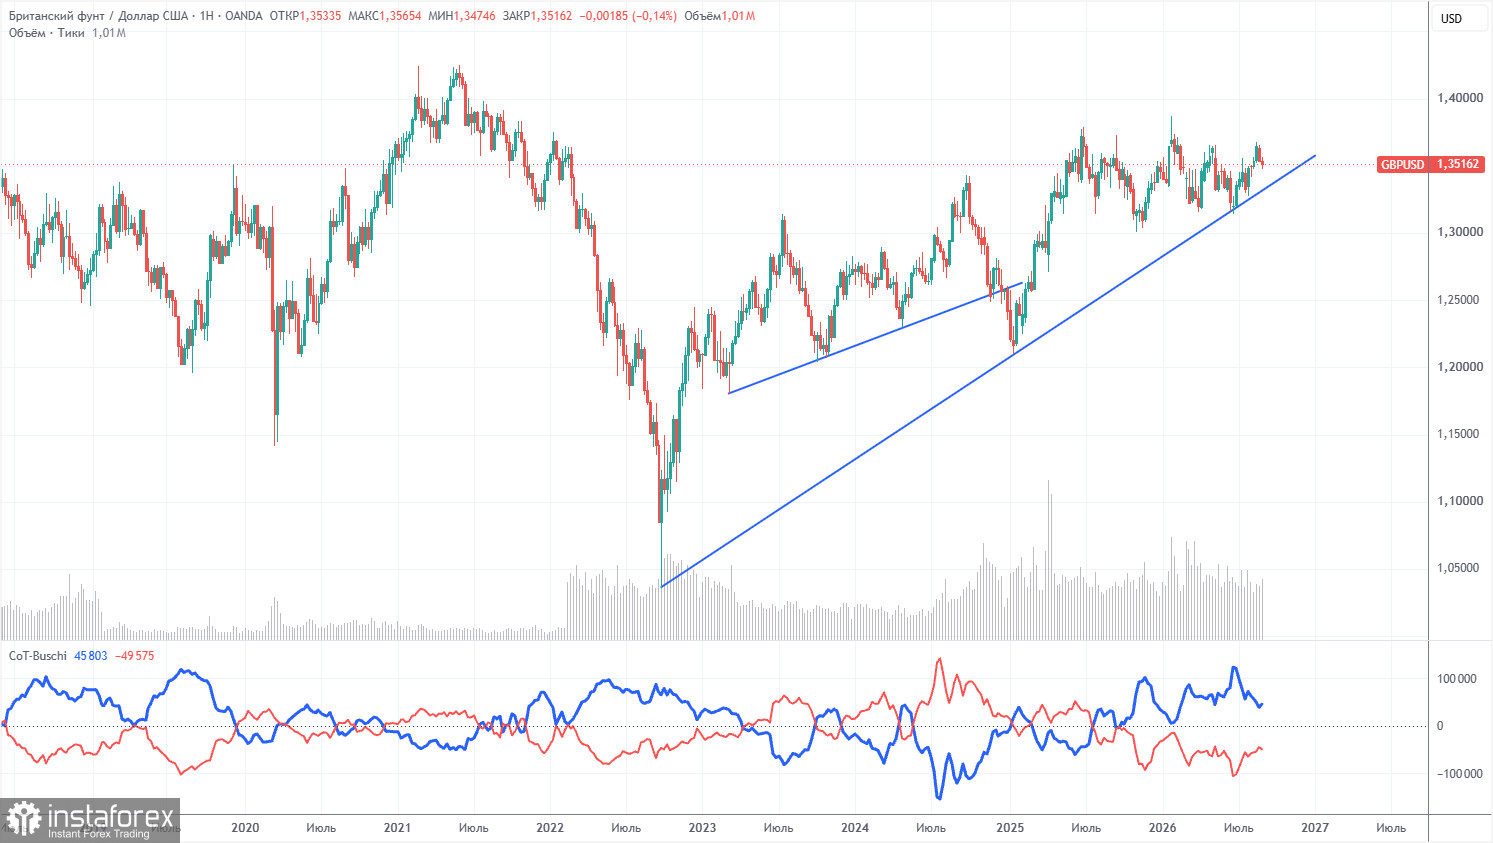
COT reports for the pound show non-commercial traders have been net short for several months. The net position is negative despite a long-term uptrend. Given events in the Middle East, strong demand for the dollar in H1 2026 was unsurprising. The war is not formally over, and only geopolitics could support the dollar in the near term. However, until price closes below the trendline, we would not expect a strong sustained fall in GBP/USD.
In the long term, the dollar continues to weaken due to Trump's policies, visible on the weekly TF. The trade war will persist in some form, and Trump's policy tends to weaken the US currency. The long-term uptrend for the pound remains, as indicated by the trendline. According to the latest COT (Sept 1), Non-commercials closed 8,200 BUYs and 3,100 SELLs, so the net position decreased by 5,100 contracts that week.
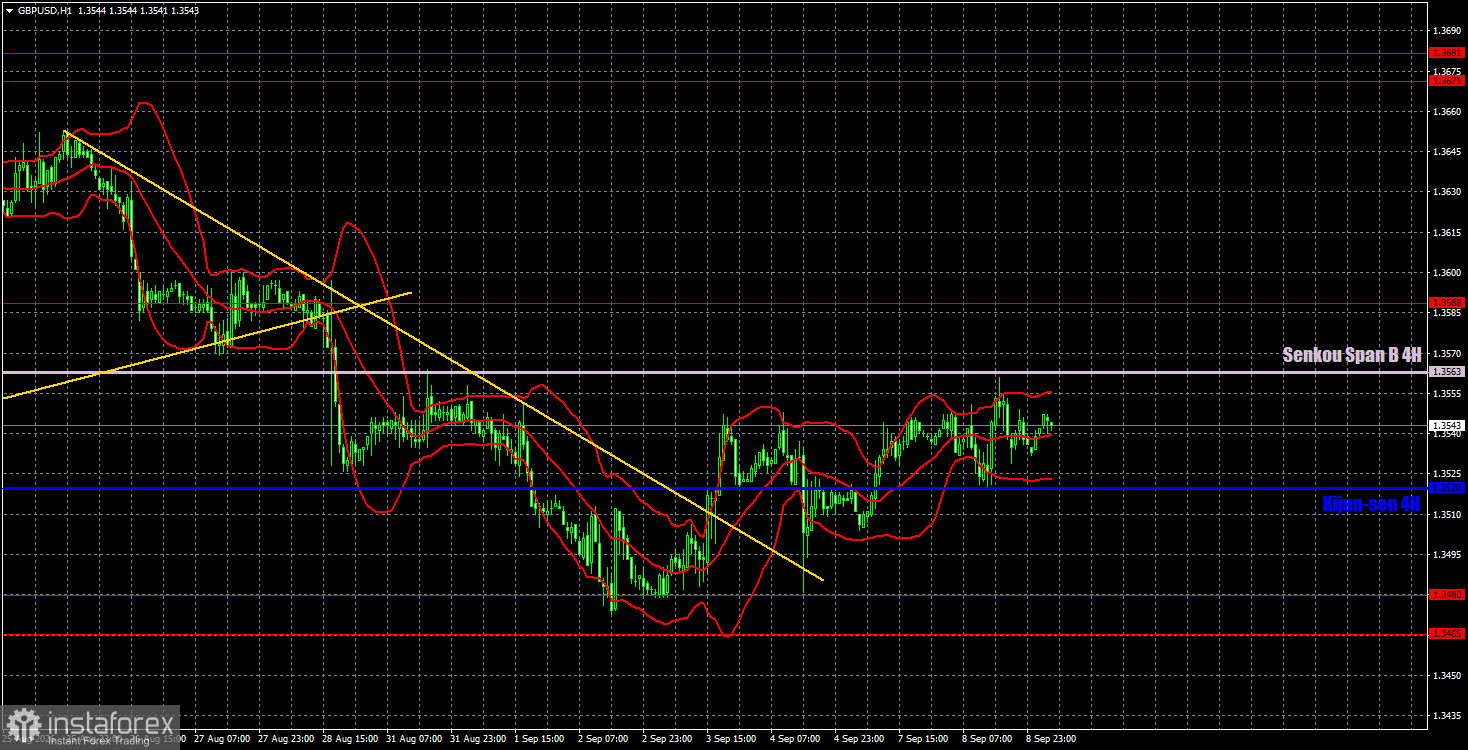
On the hourly TF, the pair may start a new upward trend. Medium- and long-term, the pound remains biased upward, so further gains are logical. We still see no strong reasons for prolonged dollar strength, and recent important US reports did not materially support the dollar.
For September 9 we highlight the following important levels: 1.3042–1.3050, 1.3096–1.3115, 1.3179–1.3187, 1.3301–1.3309, 1.3369–1.3377, 1.3465–1.3480, 1.3588, 1.3671–1.3681. Senkou Span B (1.3563) and Kijun-sen (1.3520) may also provide signals. Move Stop Loss to breakeven when price moves 20 pips in the favorable direction. Ichimoku lines may shift intraday and should be accounted for when taking signals.
No major UK or US events are scheduled on Wednesday; the US will release only the weekly ADP, which attracts little interest. The most important events are again at the end of the week, so volatility may remain low today.
Today, traders can open short positions with targets of 1.3520 and 1.3465-1.3480 if the price bounces off the Senkou Span B line. Long positions can be opened if they consolidate above the Senkou Span B line with targets of 1.3588 and 1.3671-1.3681. However, we probably won't see any strong movements today either.
Support and resistance price levels are thick red lines where movement may conclude. They are not sources of trading signals.
The Kijun-sen and Senkou Span B lines are Ichimoku indicator lines transferred to the hourly timeframe from the 4-hour timeframe. They are strong lines.
Extreme levels are thin red lines from which the price has previously rebounded. They are sources of trading signals.
Yellow lines indicate trend lines, trending channels, and any other technical patterns.
Indicator 1 on COT charts shows the size of the net position of each category of traders.


