
See also


 22.07.2026 04:00 AM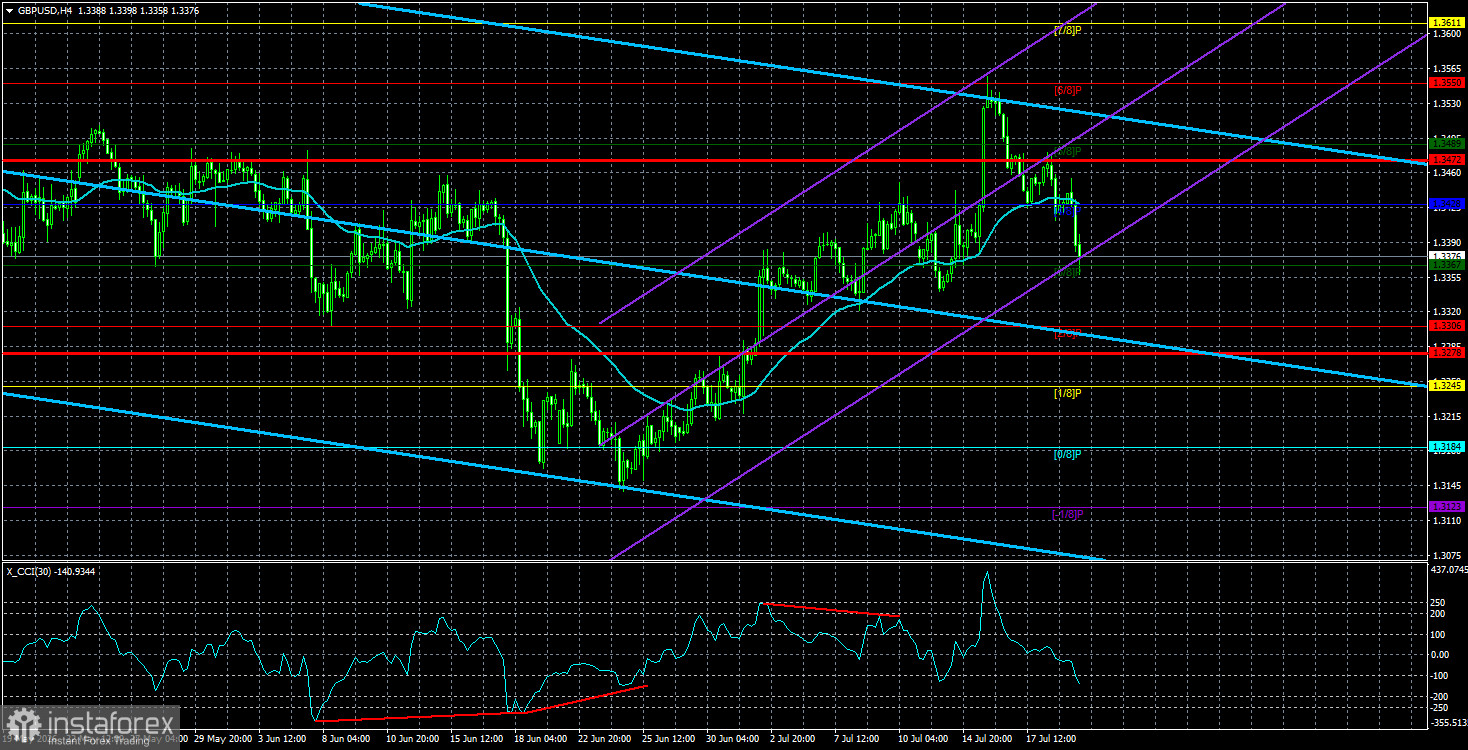
The GBP/USD currency pair continued its downward movement on Tuesday. The situation in the currency market has become very interesting. The European currency has been effectively flat for four weeks, while the British pound initially rose by 400 pips and is now plummeting at the same speed. However, if we take a closer look, the British pound is currently trading even more logically than the euro.
Some may say that there were no grounds for the growth of the British currency. Formally, this is correct. However, we would like to point out that a month ago, there were also no grounds for the dollar's rise. The Federal Reserve had not yet raised the key rate, and the market was already rushing to buy the American currency. After a geopolitical conflict began, the dollar grew; when the geopolitical conflict ended or was put on pause, the dollar grew again. Illogical. Therefore, the latest round of strengthening of the British currency is a restoration of fair value and a logical technical movement within the horizontal channel on the weekly timeframe. Recall that the pair has tested the lower area of this channel, so the movement toward the upper boundary was expected.
The fall of the British pound in recent days is nothing more than a correction. A normal technical correction against strong growth. The CCI indicator initially formed a bearish divergence and then entered the overbought area. In other words, we received two warnings about the impending decline.
This morning, the UK will publish its June inflation report, which will hint at what decisions to expect from the Bank of England at upcoming meetings. Recall that the inflation rate in the UK has decreased from 3.8% to 2.8% since September last year. Today, it may drop to 2.6%. This means that the British economy has seemingly not noticed the energy crisis, and prices continue to decrease confidently. Why should the BoE tighten monetary policy in this case? Therefore, the British pound may continue its decline today.
However, we also want to remind you that, according to Andrew Bailey, inflation may surge in the second half of 2026, while inflation in the US at the end of July is expected to continue to slow down. Simply put, one report under the current circumstances cannot give a complete picture of what is happening. Inflation depends on oil prices, and oil prices depend on geopolitics. In June, Brent fell to $70 per barrel, and in July, it rose to $90. What will happen in August is anyone's guess. Thus, inflation in Britain, the US, or the European Union may also fluctuate just like oil prices, which respond to the constantly changing situation in the Middle East.
We expect a correction in the British pound in the coming days, but this correction will not last forever. The upper boundary of the horizontal channel on the weekly timeframe has not been reached. Therefore, a correction and a resumption of growth toward the 37-38 levels are expected.
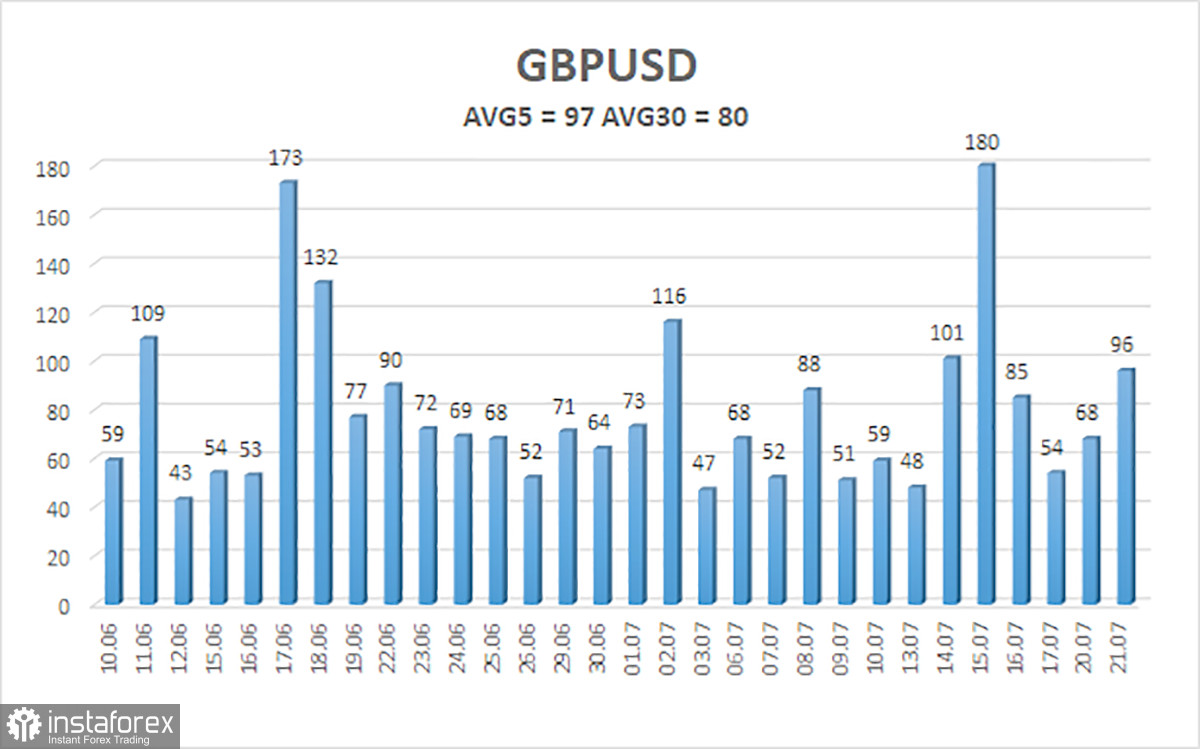
The average volatility of the GBP/USD pair over the last 5 trading days is 97 pips. For the pound/dollar pair, this value is considered "average." On Wednesday, July 22, we expect movement within the range limited by levels 1.3278 and 1.3472. The upper channel of linear regression is pointing downwards, indicating a downward trend. The CCI indicator has formed a bearish divergence and entered the overbought area – a downward correction has begun.
S1 – 1.3367
S2 – 1.3306
S3 – 1.3245
R1 – 1.3428
R2 – 1.3489
R3 – 1.3550
The GBP/USD currency pair maintains an upward trend. Donald Trump's policies will continue to exert pressure on the US economy, so we do not expect long-term growth from the American currency. The year 2026 is currently super-positive for the dollar due to geopolitics, but every fairytale comes to an end. However, a flat remains on the weekly timeframe between levels 1.3150 and 1.3780 within a four-year upward trend, which allows us to expect a continuation of the growth of the British currency in the medium term. Long positions with targets of 1.3489 and 1.3550 can be considered when the price is above the moving average. When the price is below the moving average line, trading downward with targets of 1.3306 and 1.3278 is allowed.
The channels of linear regression help determine the current trend. If both are pointed in one direction, it means the trend is currently strong.
The moving average line (settings 20,0, smoothed) determines the short-term trend and the direction in which trading should currently be conducted.
Murray levels are target levels for movements and corrections.
Volatility levels (red lines) are the likely price channel in which the pair will spend the next day, based on current volatility metrics.
The CCI indicator's entry into the oversold area (below -250) or into the overbought area (above +250) indicates that a trend reversal in the opposite direction is approaching.


