See also

 28.04.2026 04:06 AM
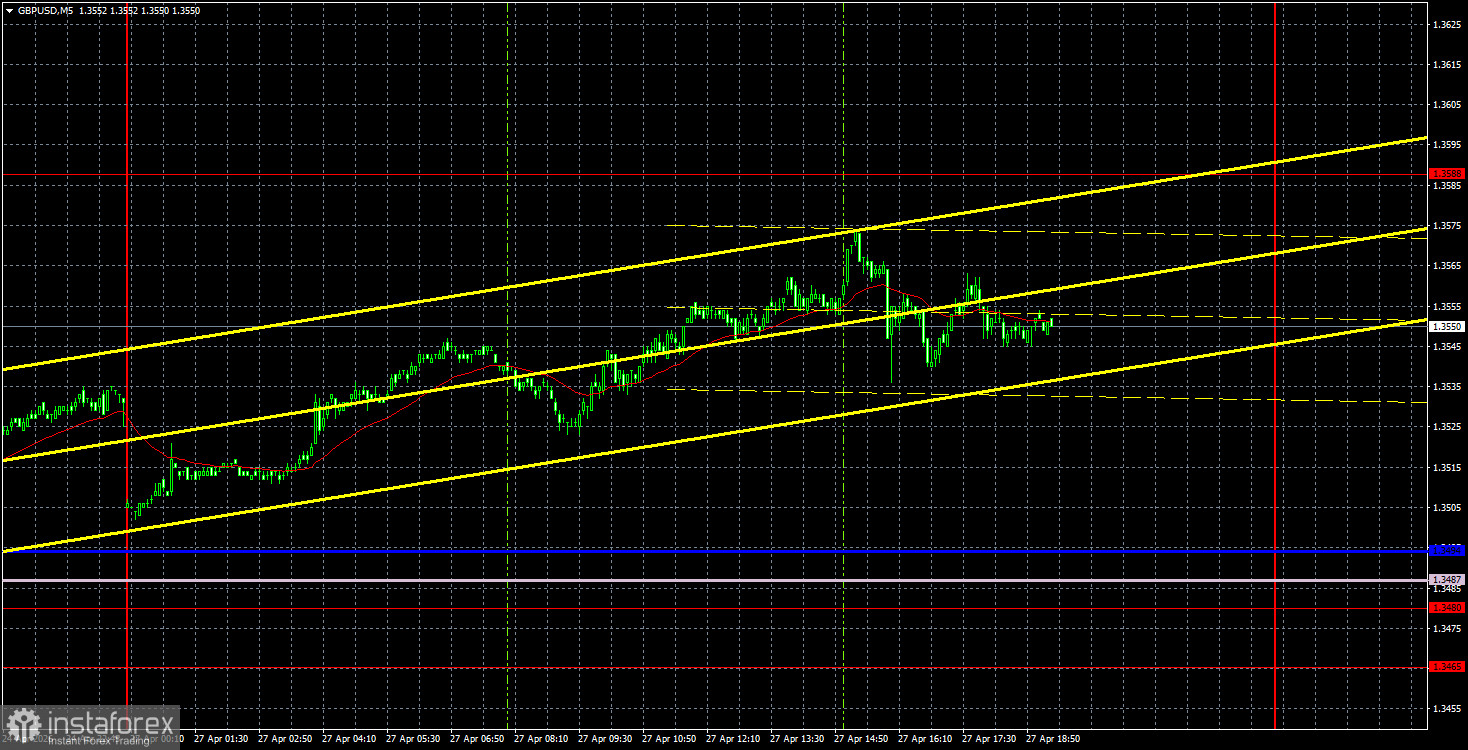
Throughout Monday, the GBP/USD currency pair also traded with a rise; however, unlike the EUR/USD pair, it maintains an upward trend. The attempt to breach the nearest support area of 1.3465-1.3480 was unsuccessful, so the British pound is now much closer to continuing a flat trend than to a downward trend. Moreover, the British pound is positioned above the Ichimoku indicator lines, suggesting it retains its upward momentum. Therefore, we would consider a downward scenario only if the price falls below the 1.3465-1.3480 range. There was no macroeconomic or fundamental context in the UK or the US on Monday, so we observed purely technical movement throughout the day. Monday shows us that the bulls have not retreated from the market.
On the hourly timeframe, as mentioned, the upward trend remains intact. There is no trend line, but it is not needed at this time. The first half of the week is entirely devoid of fundamental and macroeconomic events, but the second half will offer traders ample opportunities. Thus, the first half of the week is technical, while the second is fundamental.
On the 5-minute timeframe, no trading signals were generated on Monday. The pair traded near the Ichimoku indicator lines but did not react to them. Therefore, traders had no basis for entering the market yesterday.
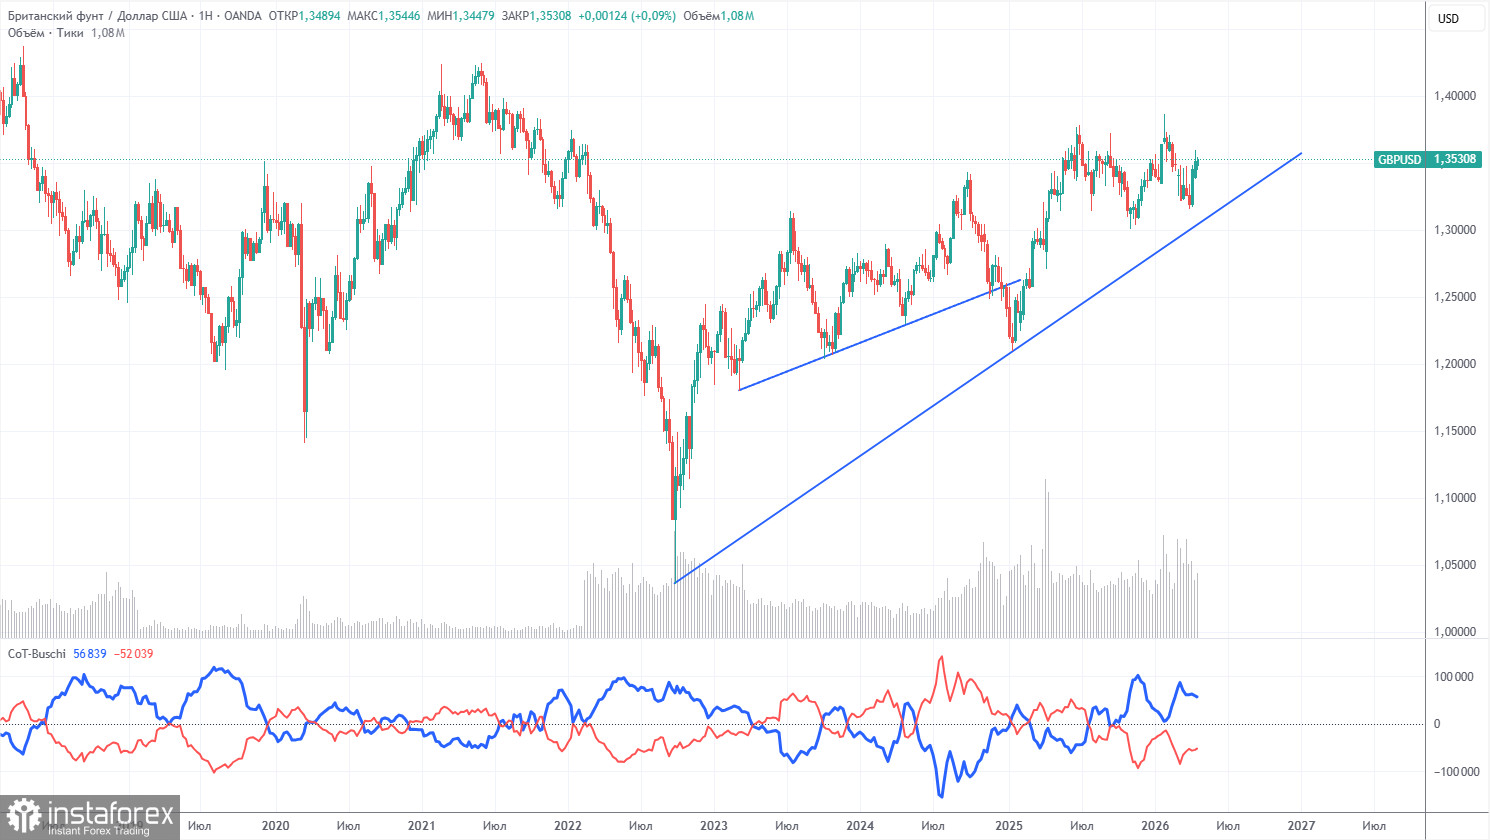
The COT reports for the British pound show that traders' sentiment has been constantly changing in recent years. The red and blue lines, which depict the net positions of commercial and non-commercial traders, frequently intersect and are generally close to the zero mark. Currently, the lines are moving apart, with non-commercial traders continuing to dominate with their sales. However, considering the events in the Middle East, it is no surprise that demand for risk currencies is falling while demand for the dollar is rising.
In the long term, the dollar continues to decline due to Donald Trump's policies, as clearly seen on the weekly timeframe (illustration above). The trade war will continue in one form or another for a long time, and Trump's policies are aimed both directly and indirectly at weakening the American currency. However, geopolitical factors currently take precedence, which have recently provided significant support for the dollar. As the conflict in the Middle East remains unresolved, the U.S. dollar may still have growth potential. According to the latest COT report (dated April 21), the "Non-commercial" group opened 8,100 BUY contracts and 5,500 SELL contracts. Thus, the net position of non-commercial traders increased by 2,600 contracts over the week.
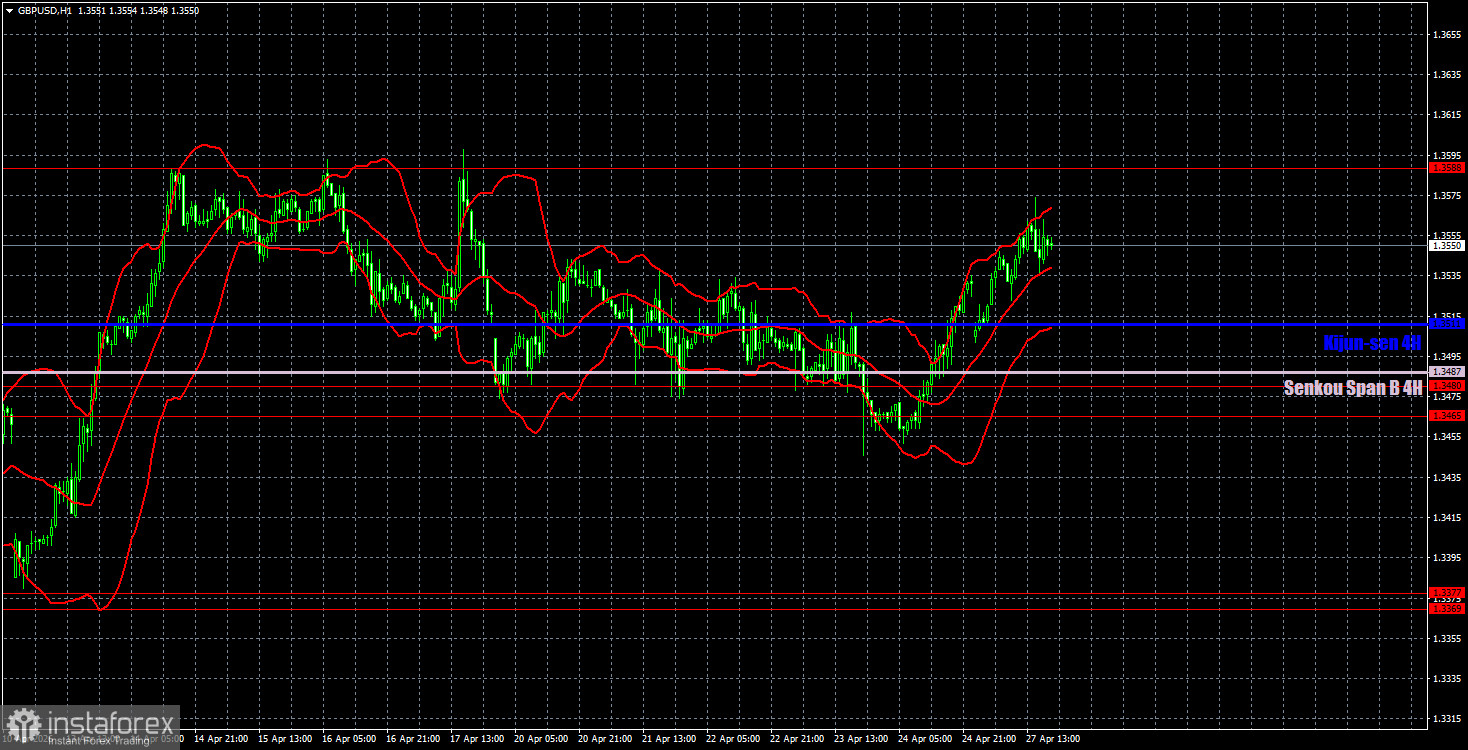
On the hourly timeframe, the GBP/USD pair continues to form an upward trend, which may be disrupted if a full-scale war resumes in the Middle East. It should be noted that the influence of geopolitics is weakening amid recent developments, although military actions in the region are currently on pause. The Strait of Hormuz remains blocked, and there is no progress in negotiations; however, according to some information, discussions continue without formal meetings or confirmations.
For April 28, we highlight the following important levels: 1.3096-1.3115, 1.3179-1.3187, 1.3369-1.3377, 1.3465-1.3480, 1.3588, 1.3671-1.3681, and 1.3751-1.3763. The Senkou Span B line (1.3487) and the Kijun-sen line (1.3511) may also serve as sources of signals. It is recommended to set the Stop Loss order to breakeven if the price moves 20 pips in the correct direction. The Ichimoku indicator lines may shift throughout the day, which should be taken into account when determining trading signals.
On Tuesday, there are no important events scheduled in the UK, and the US will release only a minor ADP report on a weekly basis. Volatility was low on Monday and is likely to remain low on Tuesday as well.
Today, traders may consider short positions targeting 1.3511 if the price bounces off 1.3588. Long positions can be opened with a target of 1.3588 if the price bounces off the Ichimoku indicator lines or from the 1.3465-1.3480 area.
Price levels of support and resistance – thick red lines, around which the movement may end. They are not sources of trading signals.
Kijun-sen and Senkou Span B lines – lines of the Ichimoku indicator that are carried over to the hourly timeframe from the 4-hour one. They are strong lines.
Extreme levels – thin red lines from which the price has previously bounced. They are sources of trading signals.
Yellow lines – trend lines, trend channels, and any other technical patterns.
Indicator 1 on COT charts – the size of the net position of each category of traders.


