
Vea también


 29.09.2026 04:49 AM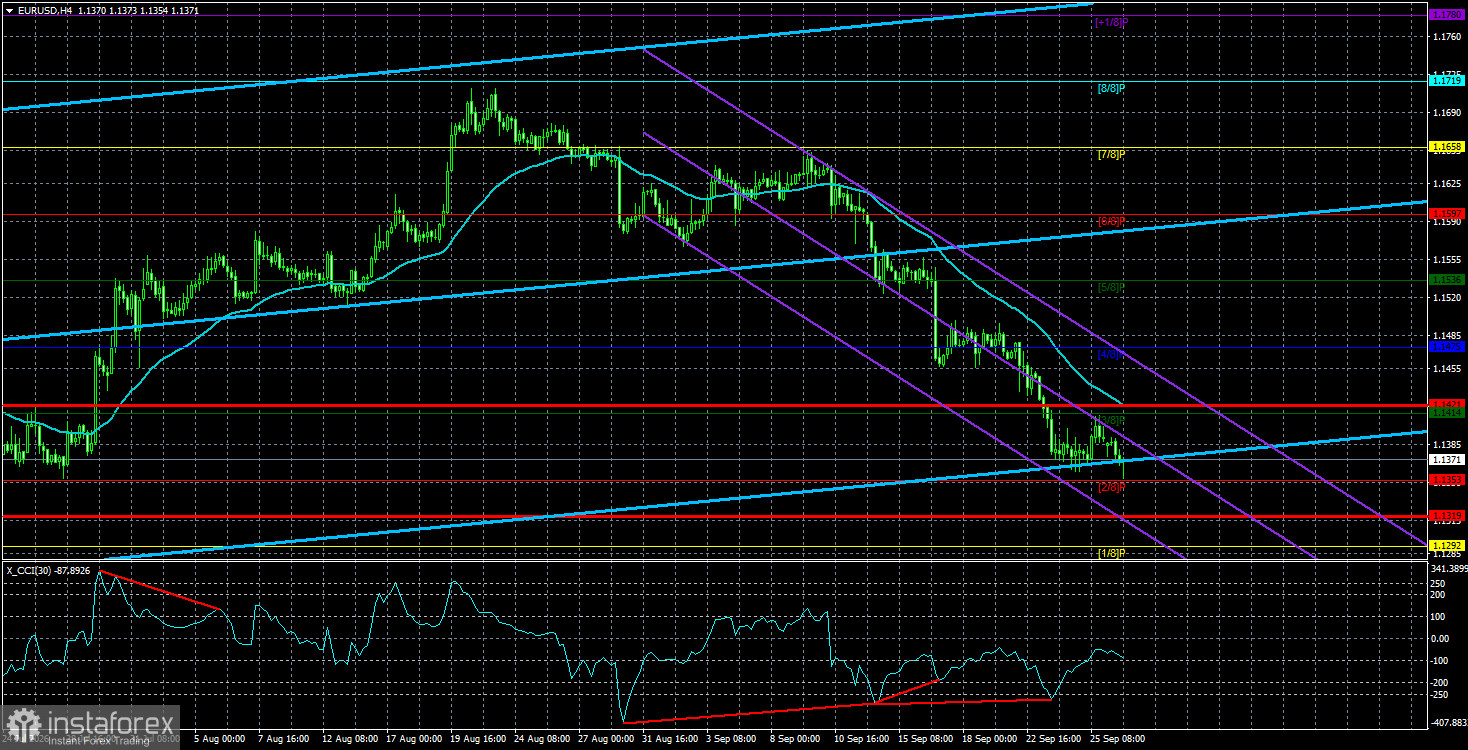
The EUR/USD pair traded very calmly on Monday, as expected. Yet the market did not attempt to begin a bullish correction. The US dollar has risen for three consecutive weeks, which is a kind of record. During this time, we have not seen a single correction or even a pullback. Tell me, when was the last time the pair showed a three-week one-way move on a Federal Reserve decision to tighten or ease policy?
The longer it goes on, the clearer it becomes to more traders that something is wrong. The Fed did take a tougher stance in September than expected, but the market had already priced in several rounds of tightening before. This was not a bolt from the blue. So where's the catch?
In our view, there are a few possible explanations, none of which traders are likely to like. We are not among those analysts who try to explain every move by the current news flow. So the first possible explanation is manipulation. Look at the daily or weekly timeframe even without any indicators. For almost a year, the market has been flat, or very close to one. When the market is flat, moves inside it are to some extent random. Recall that flat periods are essentially times of accumulation of new positions or distribution of previously opened positions. In other words, during those periods fundamentals or macro data recede to second place because the market is busy with other matters. If a flat appears on the 4-hour timeframe, wait a few days, and moves become logical again. But if a flat forms on the weekly timeframe, how long must one wait and tolerate illogical moves?
Looking at the shorter term, where the dollar has been rising for about six weeks, another possibility is inertia. In plain terms: the dollar rises because it is being bought, and it is being bought because it rises. Note the CCI indicator, which has already produced three "bullish" divergences and entered the overbought zone three times. Yet the market reacts to nothing right now — neither fundamentals, nor geopolitics, nor macro data. Since the Fed's meeting and its hawkish tilt were the last significant event favoring the dollar, most experts have been explaining the dollar's rise by that event for three weeks running.
We believe that however long the US dollar's rally continues, its long-term prospects remain unchanged. The dollar cannot sustainably appreciate globally if the world is on a course of de-dollarization and Donald Trump pursues protectionist policies that push others away from the US. Therefore, however high the dollar goes, we expect it to fall eventually — at least while Trump is president and until a new war somewhere forces investors to flee again into the dollar.
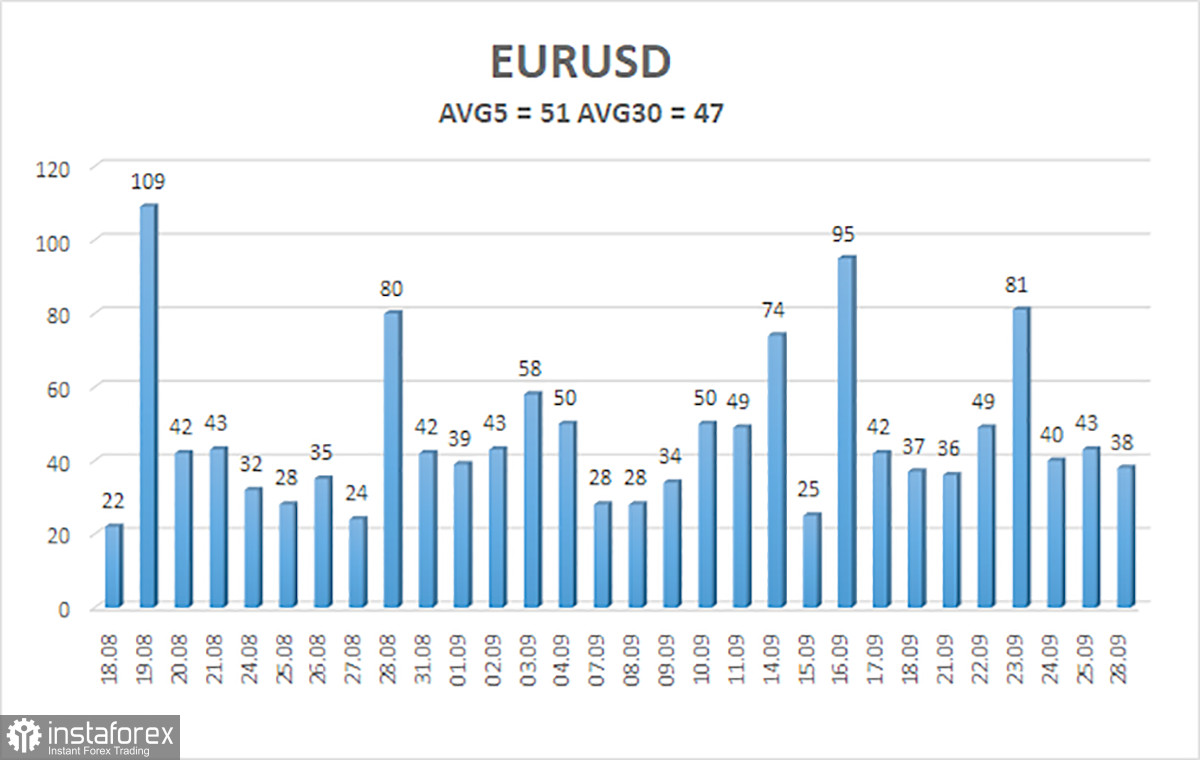
The average volatility of the EUR/USD currency pair over the last 5 trading days as of September 29 is 51 pips and is characterized as "average." We expect the pair to move between 1.1319 and 1.1421 on Tuesday. The higher linear-regression channel is pointing upward, indicating an uptrend. The CCI indicator entered the oversold area three times and formed three "bullish" divergences, which warn of the end of the illogical downward trend. However, the market is not reacting to anything right now.
S1 – 1.1353
S2 – 1.1292
S3 – 1.1230
R1 – 1.1414
R2 – 1.1475
R3 – 1.1536
The EUR/USD pair continues to move downward, but we still view the decline as a correction before a new upward trend. The global fundamental backdrop for the dollar remains negative, but in 2026, geopolitics first, and then the Fed's hawkish stance, provided strong support to the US currency. When price is below the moving average, short positions can be considered with targets of 1.1319 and 1.1292. Above the moving average, long positions are relevant, with targets of 1.1475 and 1.1536.
Regression channels help determine the current trend. If both are directed in the same direction, it means the trend is currently strong;
The moving average line (settings 20,0, smoothed) defines the short-term trend and the direction in which trading should be conducted at present;
Murray levels are target levels for moves and corrections;
Volatility levels (red lines) are the probable price channel within which the pair will spend the next 24 hours based on current volatility indicators;
The CCI indicator – its entry into the oversold area (below -250) or the overbought area (above +250) indicates that a trend reversal in the opposite direction is approaching.


