Vea también

 27.02.2026 12:47 PM
Trade Review and Advice on Trading the Japanese Yen
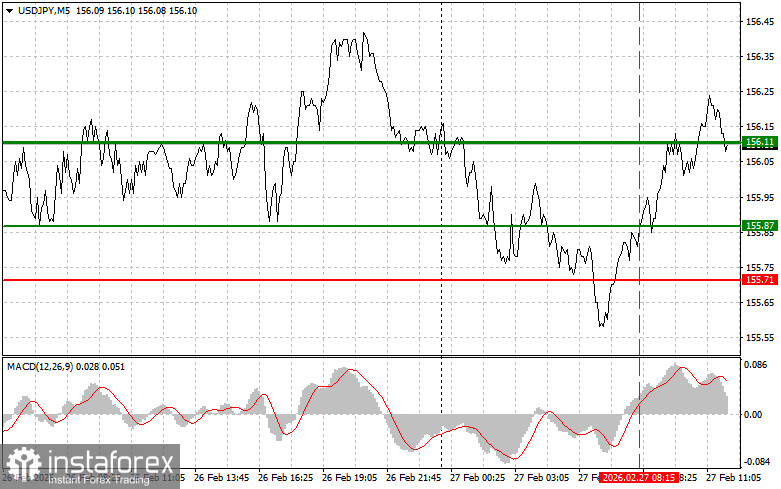
The test of the 155.87 level occurred when the MACD indicator had already moved significantly upward from the zero line, which limited the pair's upward potential. For this reason, I did not buy the dollar and missed the upward movement.
Next, market attention will focus on the release of several important macroeconomic indicators. One of the key events will be the publication of the Producer Price Index (PPI), both the headline figure and the core index excluding food and energy prices. These data provide insight into inflationary pressure at the early stages of the production cycle. An increase in these indicators could lead to further growth in the USD/JPY pair.
After that, data on the Chicago PMI will be released. Strong Chicago PMI figures, indicating stability or growth in manufacturing activity, will be perceived as a positive signal for the overall economic outlook. Taken together, these reports are expected to determine the direction of the dollar against the yen by the end of the week.
If weak data are published—for example, if the PPI comes in below forecasts or the Chicago PMI shows a slowdown—the market may reassess expectations regarding the U.S. economy and Federal Reserve policy. This would weaken the dollar and restore pressure on USD/JPY, as seen during the Asian trading session.
As for the intraday strategy, I will mainly rely on implementing Scenarios No. 1 and No. 2.
Buy Signal
Scenario No. 1: I plan to buy USD/JPY today upon reaching the entry point around 156.23 (green line on the chart), targeting growth toward 156.52 (thicker green line on the chart). Around 156.52, I plan to exit long positions and open short positions in the opposite direction (expecting a 30–35 point move from that level). Growth in the pair today can be expected after strong data.Important: Before buying, make sure the MACD indicator is above the zero line and just beginning to rise from it.
Scenario No. 2: I also plan to buy USD/JPY if there are two consecutive tests of the 156.00 level while the MACD indicator is in the oversold area. This will limit the pair's downward potential and lead to an upward reversal. Growth toward the opposite levels of 156.23 and 156.52 can be expected.
Sell Signal
Scenario No. 1: I plan to sell USD/JPY after a breakout below 156.00 (red line on the chart), which would lead to a rapid decline in the pair. The key target for sellers will be 155.74, where I plan to exit short positions and immediately open long positions in the opposite direction (expecting a 20–25 point move from that level). Pressure on the pair will return in the event of weak data.Important: Before selling, make sure the MACD indicator is below the zero line and just beginning to decline from it.
Scenario No. 2: I also plan to sell USD/JPY if there are two consecutive tests of the 156.23 level while the MACD indicator is in the overbought area. This will limit the pair's upward potential and lead to a downward reversal. A decline toward the opposite levels of 156.00 and 155.74 can be expected.
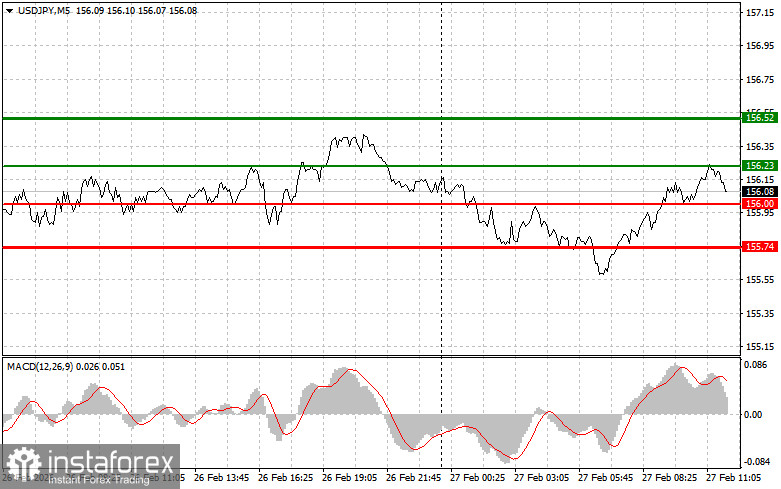
Chart Explanation
Important: Beginner Forex traders should make market entry decisions with great caution. Before major fundamental reports are released, it is best to stay out of the market to avoid sharp price fluctuations. If you decide to trade during news releases, always place stop-loss orders to minimize potential losses. Without stop-loss orders, you may quickly lose your entire deposit, especially if you do not apply proper money management and trade large volumes.
Remember that successful trading requires a clear trading plan, like the one outlined above. Spontaneous trading decisions based solely on current market conditions are an inherently losing strategy for intraday traders.


