
Lihat juga


 21.10.2026 06:24 AM
After two weeks of stagnation, Bitcoin has started to fall, but the decline so far is weak. A correction is underway, and it may take a long time. Recall that the odds that the downtrend has ended are real and not insignificant. However, the reasons for a new sustained bull trend remain ambiguous and debatable. The recent three-month Bitcoin rise was essentially a move from the lower edge of the daily sideways channel to the upper edge, after a deviation formed at the channel's lower boundary, followed by a deviation at the upper boundary. The upper-boundary deviation was deep, and if it is indeed a deviation, Bitcoin may head toward $70,800 in the near term. After that, the price would likely trade inside the flat again, and its outlook would remain uncertain.
Wintermute laid out two primary scenarios. According to its analysts, if Bitcoin fails to hold the $82,500 support level, it could crash toward $70,000. Conversely, a breakout above $87,000 would open the path to further gains. The firm also reminded investors that the Federal Reserve meeting is on October 28, and crypto market volatility can increase in the run-up to the event. U.S. midterm elections on November 3 are another risk: historically, Bitcoin has fallen decisively around past midterms — not just 5–10% but often materially more. Regarding the Fed, a hike this month is not expected, but the Fed's general tightening path remains a headwind for risk assets.
In sum, we view the risk factors and downside drivers for "digital gold" as currently outweighing the growth drivers. In particular, stronger US inflation could push the Fed into a hawkish stance that is negative for crypto. Note that the $70,000 goal is almost the same as our $70,800 goal. If Bitcoin has formed a deviation of the upper boundary of the side channel on the daily timeframe, then the middle of the side channel is located near the level of $ 70,800.
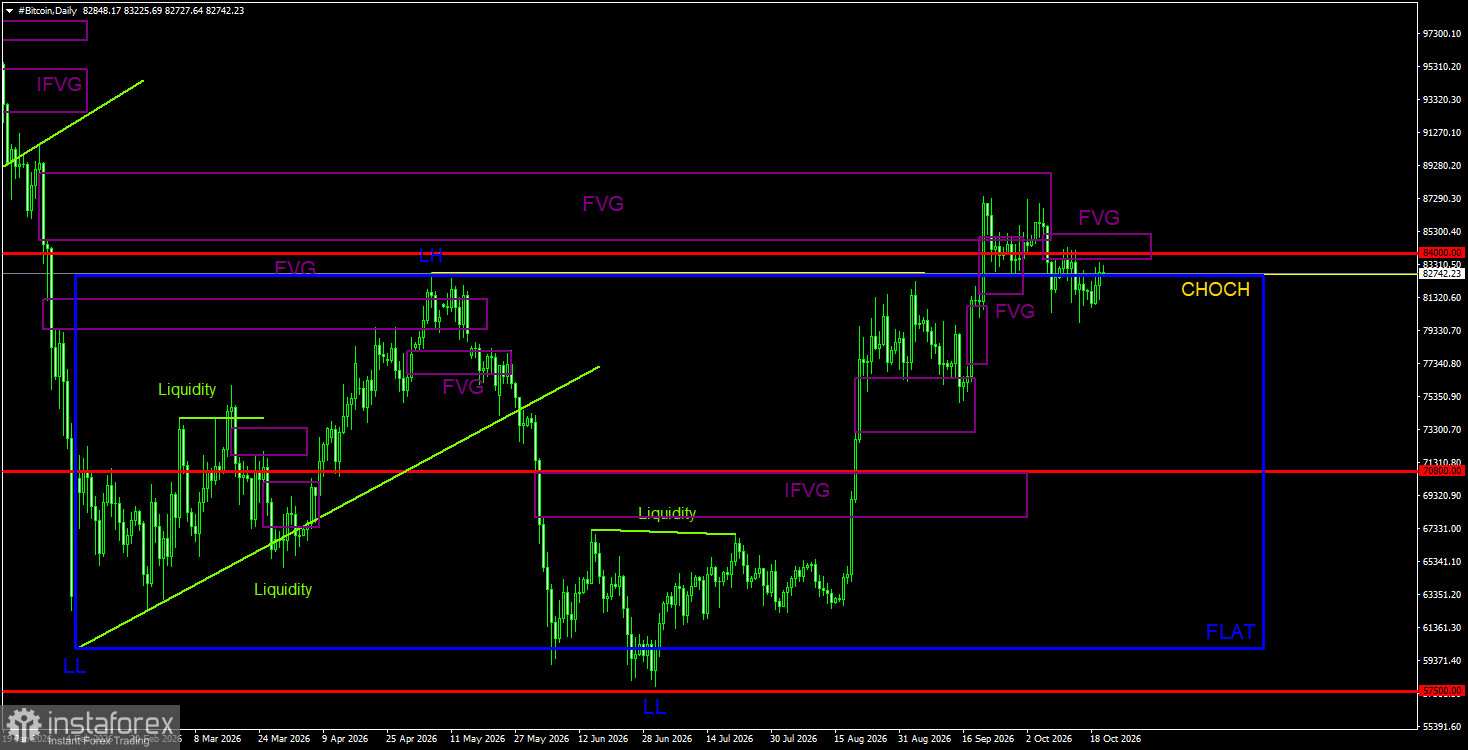
On the daily timeframe, the bearish trend structure has broken, so "digital gold" has likely entered the process of forming a new bull trend. Price filled the bearish FVG from the prior trend, reacted to that pattern, and a correction began, as expected. A breakout beyond the $60,000–$82,500 sideways channel could still be a deviation which, combined with the reaction to the bearish FVG, may provoke a drop back toward the channel's lower edge. That gave traders grounds to open short positions. A new bearish FVG also formed, adding another sell signal.
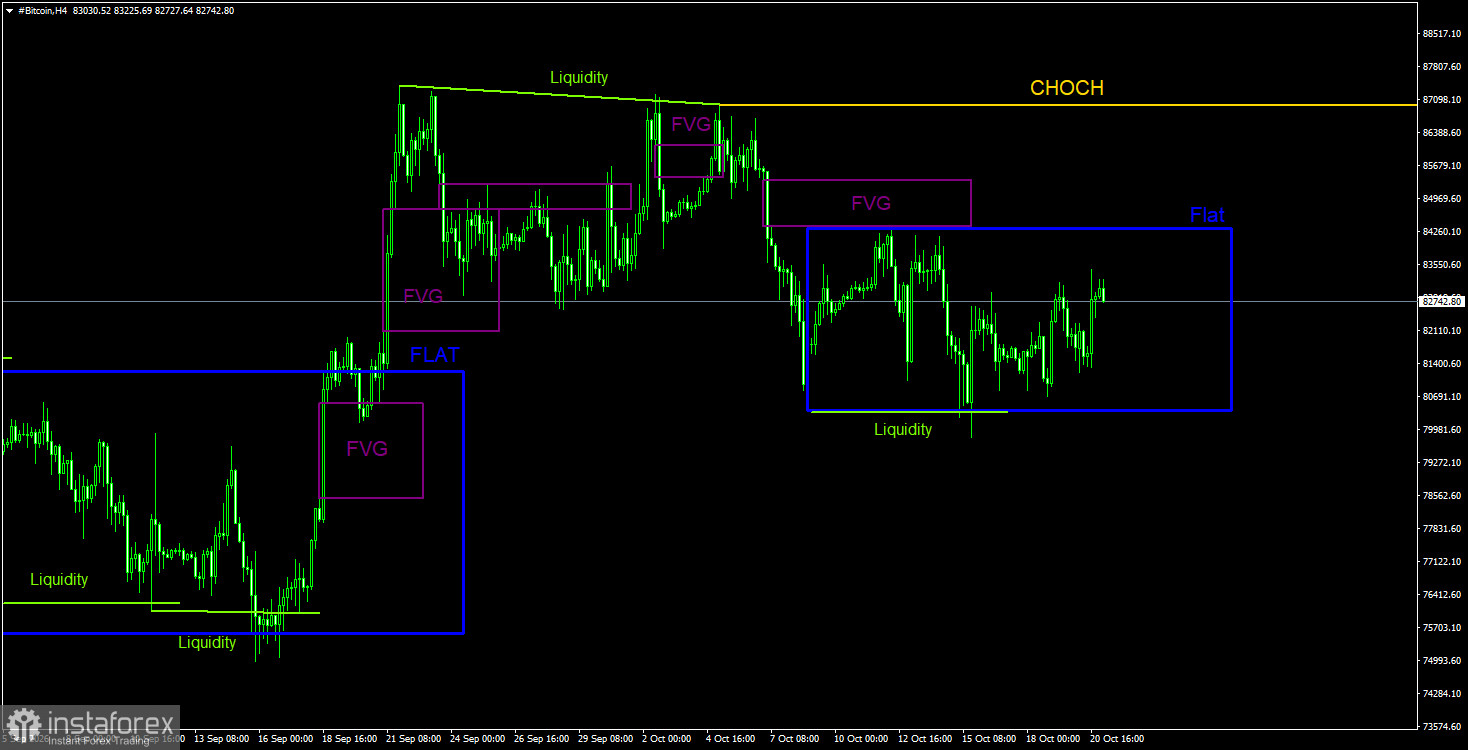
On the 4-hour timeframe, a bearish structure has begun to form. The CHOCH line currently sits near $87,000. On the daily timeframe, all requisite bearish reversal signals were generated, allowing traders to open short positions. Bitcoin's targets are best defined by the daily-chart sideways channel, which we still view as valid. On the 4-hour chart, the most recent bearish FVG triggered a price reaction that caused a new decline in the leading cryptocurrency. The only concern now is another flat and the removal of buy liquidity at the previous low. Bitcoin may spend some time inside the $80,400–$84,300 range.
Bitcoin shows signs of the start of a new bull trend. As often happens, this trend begins with a pump that lacks concrete, clear reasons. The Fed has not begun easing, and the Clarity Act bill has not passed. In the near term, on the daily timeframe, Bitcoin may still be declining, since price reacted to the bearish FVG and formed two sell signals. Also note a breakout beyond the daily sideways channel could be a deviation — a deep deviation, but still a deviation. If that plays out, Bitcoin could head toward $70,800 and even maintain the downtrend that began last year. We believe short positions are most relevant in the near term. On the 4-hour timeframe, be vigilant near the upper boundary of the sideways channel — a deviation could form there and renew the decline.
CHOCH — Change of Character: a break in trend structure.
Liquidity — Liquidity: stop-losses and pending orders that market-makers use to accumulate positions.
FVG — Fair-Value Gap: a price-inefficiency zone. Price moves quickly through such areas, indicating one side is absent from the market. Subsequently, price often returns and reacts to these areas, continuing the main trend.
IFVG — Inverted Fair-Value Gap: after returning to such a zone, price does not react there but impulsively breaks through it and then tests it from the other side.
OB — Order Block: a candle where a market-maker opened a position with the intent to take liquidity and then establish a position in the opposite direction.


