Veja também

 03.06.2026 04:03 AM
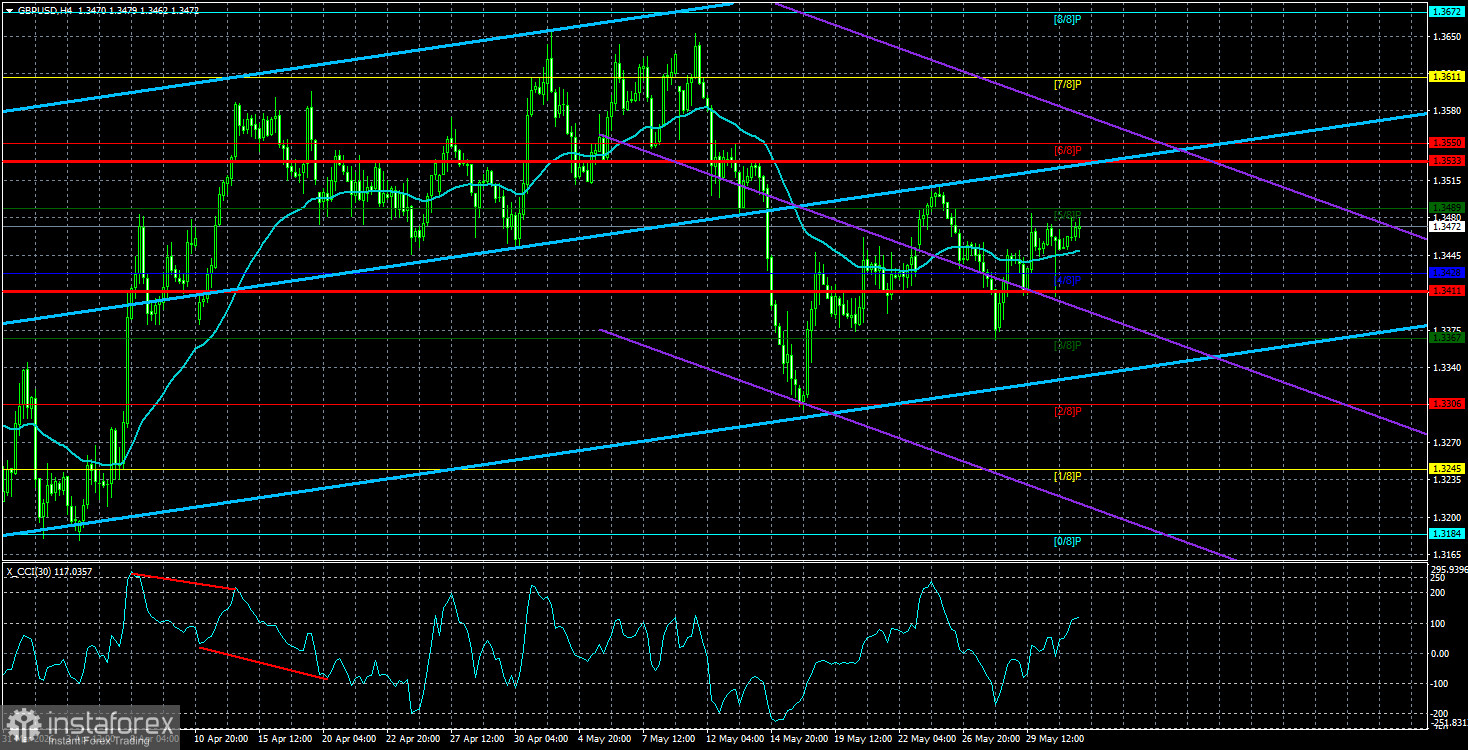
The GBP/USD currency pair traded on Tuesday with low volatility, similar to the previous two weeks. As we analyzed in the EUR/USD article, there are no compelling reasons for the market to either sell or buy at this time. The entire flow of geopolitical news can be easily summarized by one harsh fact: the parties are talking more than they are acting. Ninety percent of threats do not materialize; negotiations intermittently start and stop, and the deal that Trump claimed was "95% ready" two weeks ago has yet to be signed, even as the ceasefire remains in effect and the parties continue trying to negotiate.
We have asked before what exactly Washington and Tehran are trying to agree on, given that Iran has clearly stated it will not abandon its nuclear development or export enriched uranium. Nevertheless, negotiations continue with brief pauses, so there is still a chance for a deal. However, let's step away from the geopolitical topic, as it has already tired many. Is there a likelihood of interesting movements soon based on fundamentals, macroeconomics, or technicals?
Unfortunately, we would not place much hope in such developments under current circumstances. The market continues to ignore all the aforementioned factors, while geopolitical news is now filtered through a very strict sieve. Traders are ready to react to events such as a resumption of hostilities, a complete breakdown in negotiations, the reopening of the Strait of Hormuz, or the closure of the Bab-el-Mandeb Strait. In other words, they are prepared to respond to deeds, facts, and events rather than to words, threats, and ultimatums. Regarding macroeconomic events, a strong ISM manufacturing index was released in the US on Monday. The dollar rose for about 2 hours before falling.
Yesterday, an inflation report was released in the Eurozone, opening the door for the European Central Bank to raise rates at the next meeting. And what happened? Did anyone see a strong rise in the euro? At the end of the week, reports on the labor market and unemployment will be published in the US, and we are almost certain the market's reaction will be, at best, local. That is, the dollar may rise or fall momentarily, but within a few hours, the quotes will return to their initial positions, and the market will resume waiting for significant geopolitical events.
From a technical standpoint, the GBP/USD pair has been in a sideways trend for about 8 or 9 months, as shown on the daily timeframe. If it weren't for the war in the Middle East, which has made the US dollar much more appealing, we are confident that the global upward trend would have already resumed. It is worth noting that in January of this year, both the euro and the pound set new four-year highs, and their strengthening likely wouldn't have stopped there. But then Donald Trump intervened, and why he did so may remain unclear even to him: now the dollar no longer falls (as Trump wishes), and the Federal Reserve is set to tighten monetary policy, even with Kevin Warsh.
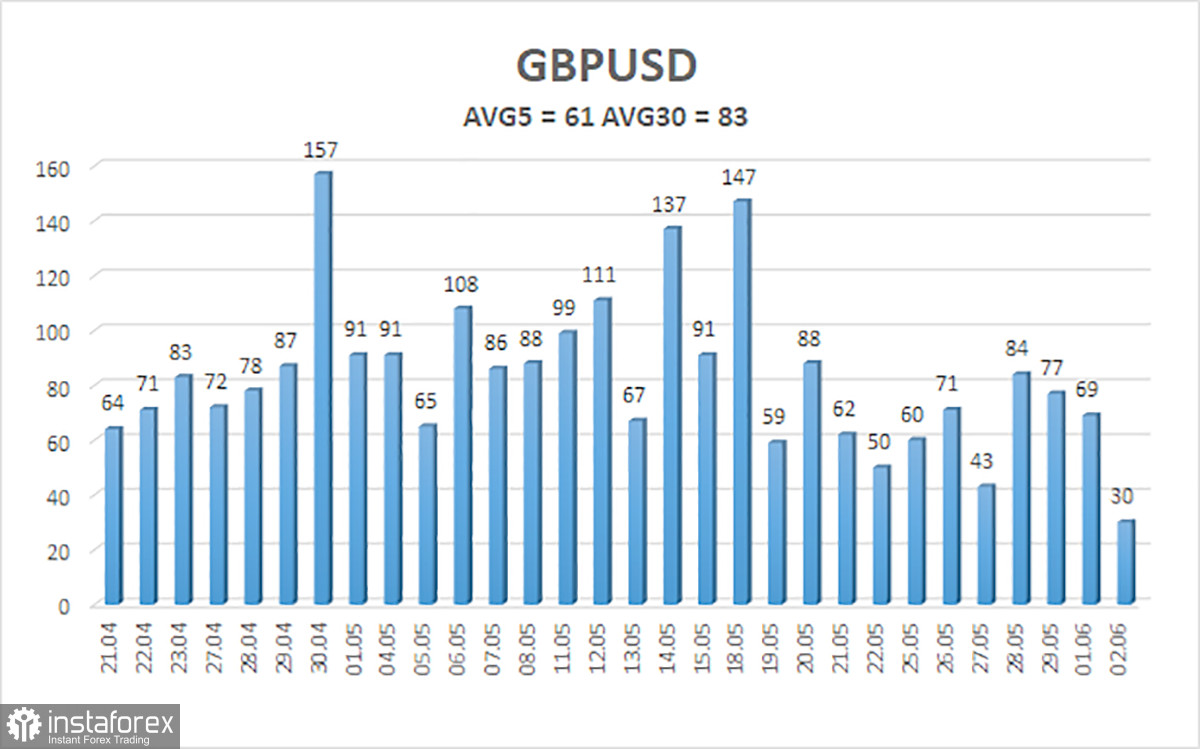
The average volatility of the GBP/USD pair over the last five trading days as of June 3 is 61 pips. For the pound/dollar pair, this value is considered "average." On Wednesday, June 3, we expect the pair to trade within the range between 1.3411 and 1.3533. The upper channel of linear regression is directed upwards, indicating a recovery of the upward trend. The CCI indicator has not formed any signals lately.
The GBP/USD pair continues to recover after a 300 pip decline. Trump's policies will continue to exert pressure on the US economy, so we do not expect the US currency to show long-term growth. However, 2026 looks super positive for the dollar due to geopolitics. Thus, long positions targeting 1.3533 and 1.3611 may be considered when the price is above the moving average. If the price is below the moving average line, short positions with targets at 1.3367 and 1.3306 may be traded based on geopolitical factors. The market often changes, and it continues to focus predominantly on geopolitical news that lacks uniformity.


