
یہ بھی دیکھیں


 24.07.2026 07:51 AM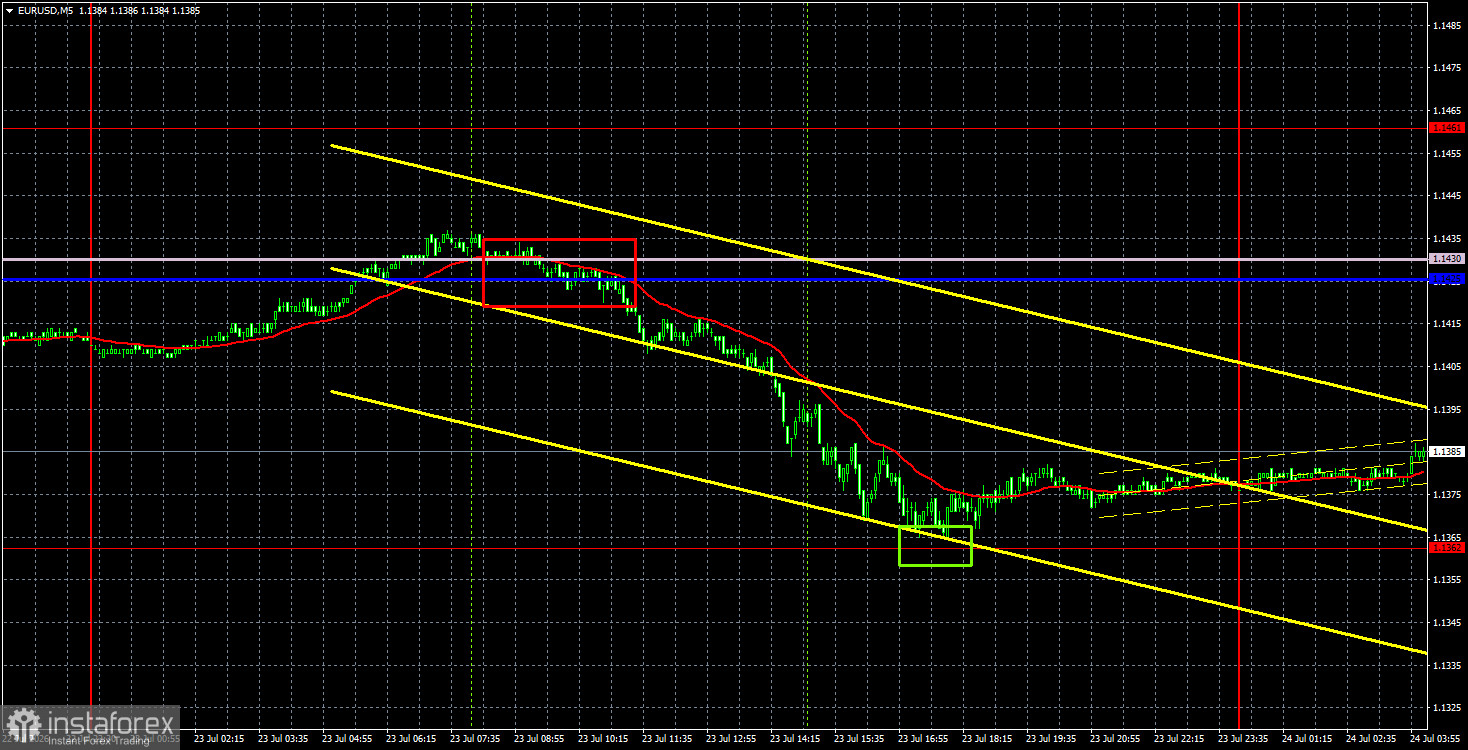
The EUR/USD currency pair finally showed some movement on Thursday, but overall the technical picture on the hourly chart has not changed. Yes, the euro lost about 70 pips during the day, which is a record volatility for it under current circumstances. However, the price remained within the sideways channel of 1.1362-1.1461. Yesterday was marked by only one event – the European Central Bank meeting. Recall that the market did not expect a second consecutive tightening of monetary policy from the ECB but allowed for the possibility of rate hikes in the future. The price of oil returned to the range of $100-120 per barrel, so it's logical to expect inflation to accelerate by the end of July. The ECB decided not to change interest rates, to take a wait-and-see approach, but also showed its readiness to resume tightening if inflation accelerates again by September. Thus, the ECB made exactly the decision the market expected, and Christine Lagarde articulated the most logical rhetoric. And this rhetoric is hawkish. Why did the euro fall? Because. On the 5-minute timeframe, it's clear that the euro's decline began several hours before the ECB's results were announced. Therefore, the market once again ignored this event.
From a technical standpoint, the pair maintains minimal bullish momentum but has effectively been flat for the fourth week. Currently, the price has dropped to the lower boundary of the sideways channel, so it is reasonable to expect either the end of the flat or a rebound from it and a new move toward the upper boundary of 1.1461.
On the 5-minute timeframe, two good trading signals were formed on Thursday. First, the pair bounced off the Ichimoku indicator lines, which provided an opportunity to open short positions. Then, it slightly worked through the level of 1.1362 and bounced from it, which allowed for opening long positions. Both trades turned out to be profitable.
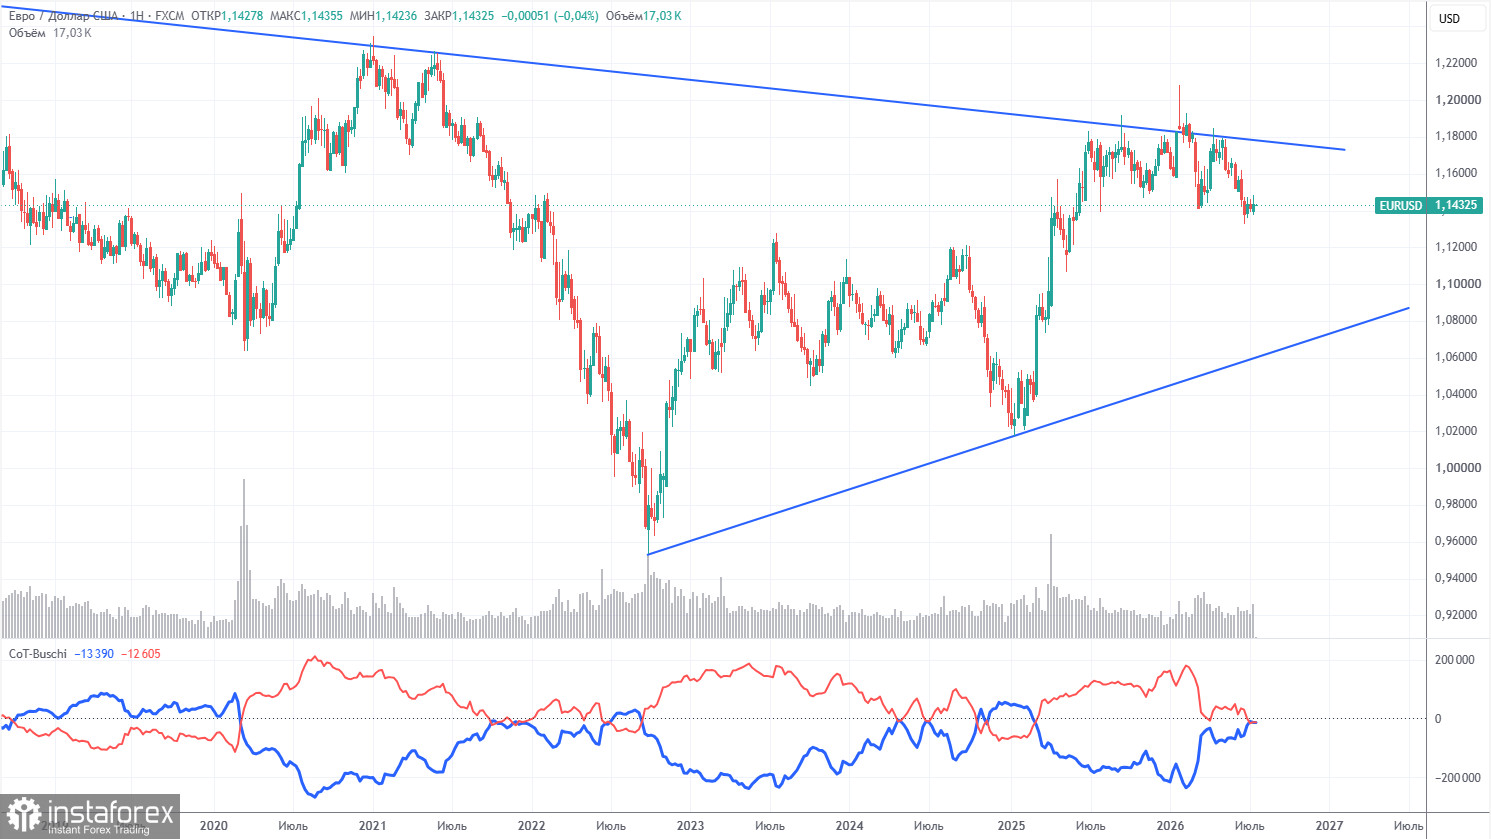
The latest COT report is dated July 14. The illustration of the weekly timeframe clearly shows that the net position of non-commercial traders remains bullish but has significantly decreased due to geopolitical events. Traders have been shedding the European currency in favor of the US dollar in recent months. Donald Trump's policies remain unchanged, but the dollar has served for a while as a "reserve currency." However, this process may already be complete.
We still do not see any fundamental factors for strengthening the European currency, while there remain sufficient factors for the decline of the American one. The war in the Middle East made the dollar temporarily super attractive, but when this factor's "shelf life" expires, everything will revert to its previous state. And it may have already expired. In the long term, the euro could fall to the level of $1.08 (the trend line), but the upward trend will remain relevant. However, during the recent months of dollar growth, the pair has not come significantly closer to this line.
The position of the red and blue lines of the indicator indicates parity between bulls and bears. Over the last reporting week, the number of long positions for the "Non-commercial" group increased by 6,900, while the number of shorts rose by 3,300. Accordingly, the net position increased by 3,600 contracts over the week.
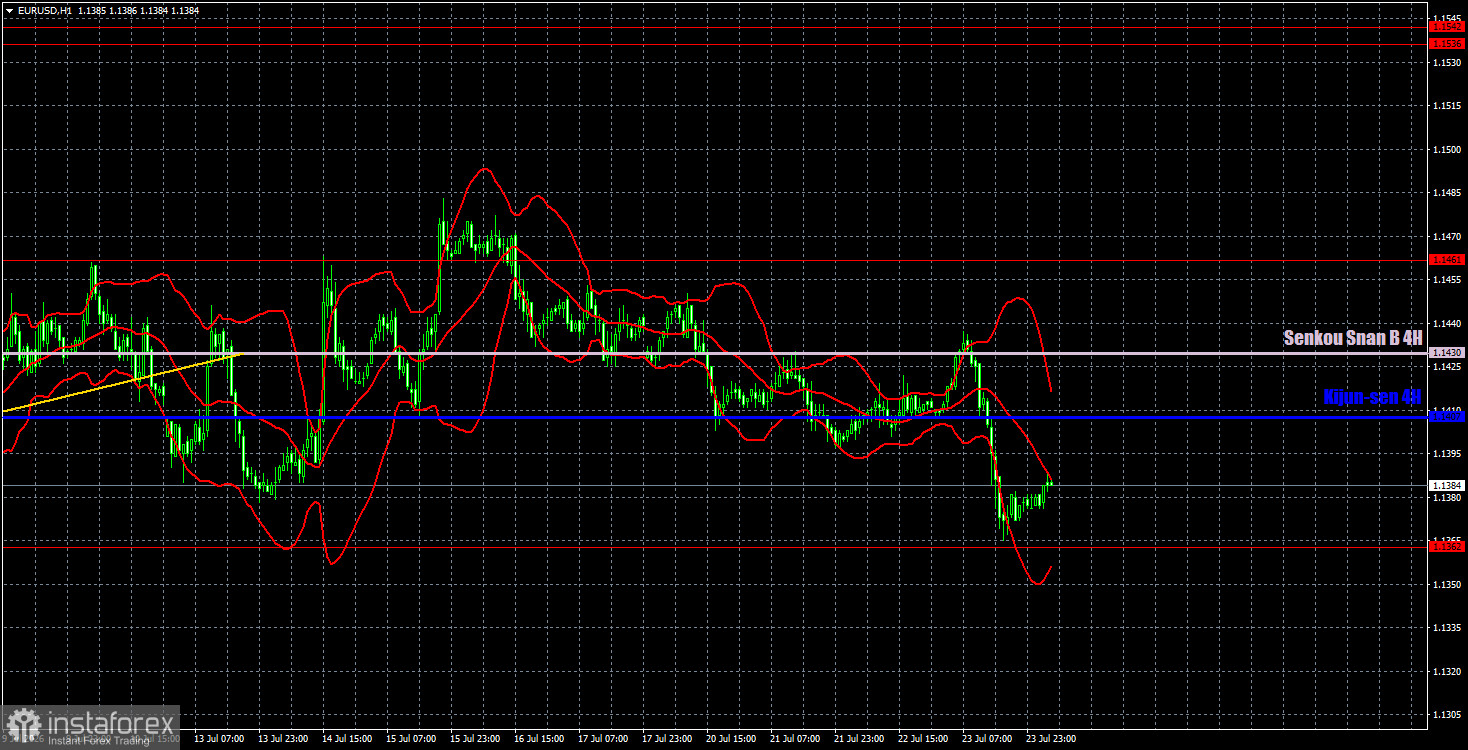
On the hourly timeframe, a corrective upward trend continues to form, essentially a flat. The situation in the Middle East remains tense and is not improving. The market continues to ignore many factors favorable to the euro, which is why the European currency cannot demonstrate any growth. The ECB meeting and the central bank's hawkish sentiment have been ignored for the second consecutive time.
On July 24, we identify the following levels for trading — 1.1234, 1.1274, 1.1362, 1.1461, 1.1536-1.1542, 1.1585, 1.1657-1.1666, 1.1750-1.1760, 1.1786, 1.1830-1.1837, as well as the lines of Senkou Span B (1.1430) and Kijun-sen (1.1407). The Ichimoku indicator lines may shift throughout the day, which should be taken into account when determining trading signals. We should also remember to set a Stop Loss at breakeven if the price moves in the correct direction by 15 pips. This will protect against potential losses if the signal turns out to be false.
On Friday, business activity indices for July will be published in Germany, the European Union, and the United States. These are not the most important data, and the market is currently trading in a sideways channel and strictly based on technical analysis. Thus, technical factors are currently paramount.
Today, traders might consider short positions targeting 1.1274 if the price consolidates below 1.1362. Long positions can be opened with targets of 1.1407 and 1.1430 if the pair bounces from the level of 1.1362. Movements in the market today may be weak once again.
Support and resistance price levels are thick red lines around which the movement may end. They are not sources of trading signals.
The Kijun-sen and Senkou Span B lines are Ichimoku indicator lines transferred to the hourly timeframe from the 4-hour timeframe. They are considered strong lines.
Extreme levels are thin red lines from which the price has previously bounced. They serve as sources of trading signals.
Yellow lines indicate trend lines, trend channels, and any other technical patterns.
Indicator 1 on the COT charts shows the size of the net position for each category of traders.


