
یہ بھی دیکھیں


 23.07.2026 04:39 AM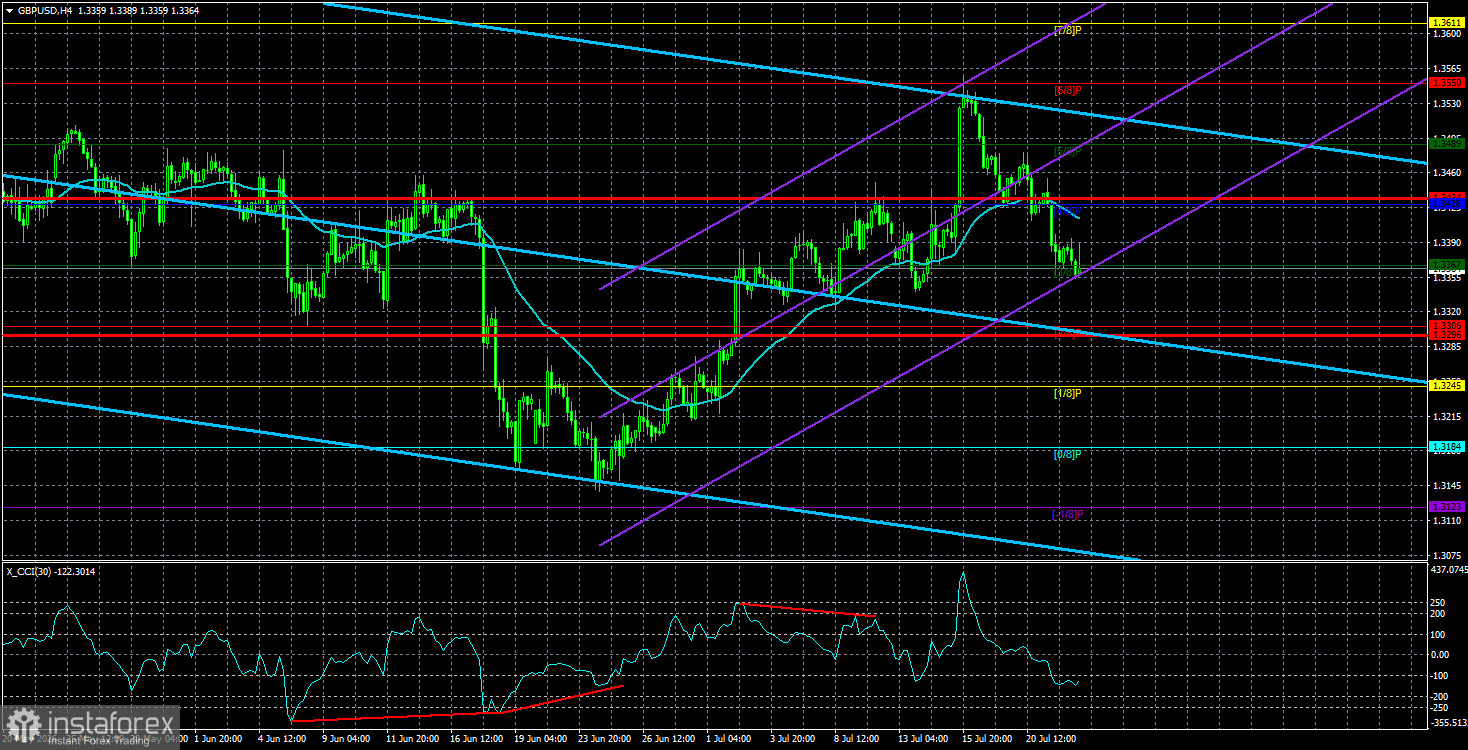
The GBP/USD currency pair continued its downward movement on Wednesday after three weeks of growth. Over the past month, the British pound has been moving very technically. The rise began around June 23 when the pair hit the area at the lower boundary of the sideways channel it has been in for a year. Since there have been no reasons for a long-term dollar trend, a reversal occurred near the channel boundary, and the movement began toward the opposite boundary. We then saw a three-week rise of 400 pips, driven by both technical and fundamental factors. Recall that the last surge in the US dollar was completely illogical. The Federal Reserve had not even begun tightening its monetary policy, yet the market rushed to buy dollars as if Kevin Warsh had promised to raise the key rate three times by the end of the year. A month and a half has passed, and the market is now doubting the tightening in July or September. Inflation in the US is falling, and if Donald Trump ends the war with Iran (which would be advantageous for him ahead of the elections), inflation will continue to decline, and tightening by the Fed will not be necessary at all.
Now we are observing a decline that has lasted about a week. Despite the UK unemployment and labor market reports on Tuesday being sufficiently positive for the pound to rise, the pound fell. Why? Because a simple technical correction began. On Wednesday, the inflation report for June was released, showing a slowdown to 2.6% year-on-year, while the market had expected a slowdown to 2.7%. It should be noted that British inflation has hardly reacted to geopolitical events in the Middle East or the energy crisis. It may still react, but for now, it has not. Therefore, the chances that the Bank of England will tighten monetary policy in 2026 have decreased even further.
Should this result in new sales of the British pound? In our opinion, no. Back in May, it became clear that British inflation does not depend on oil prices, and the next two months confirmed this assumption. Therefore, it was evident several months ago that the Bank of England would hardly raise its key rate if inflation continues to decline. Thus, the new slowdown in inflation brings the British central bank closer to easing its policy, but at the same time, Andrew Bailey warned that the consumer price index could accelerate in the second half of 2026. This suggests that inflation will likely remain between 2.5% and 3.5% over the next six months, which is not sufficient for either easing or tightening policy. Thus, the current inflation report has no long-term or global implications for the British pound.
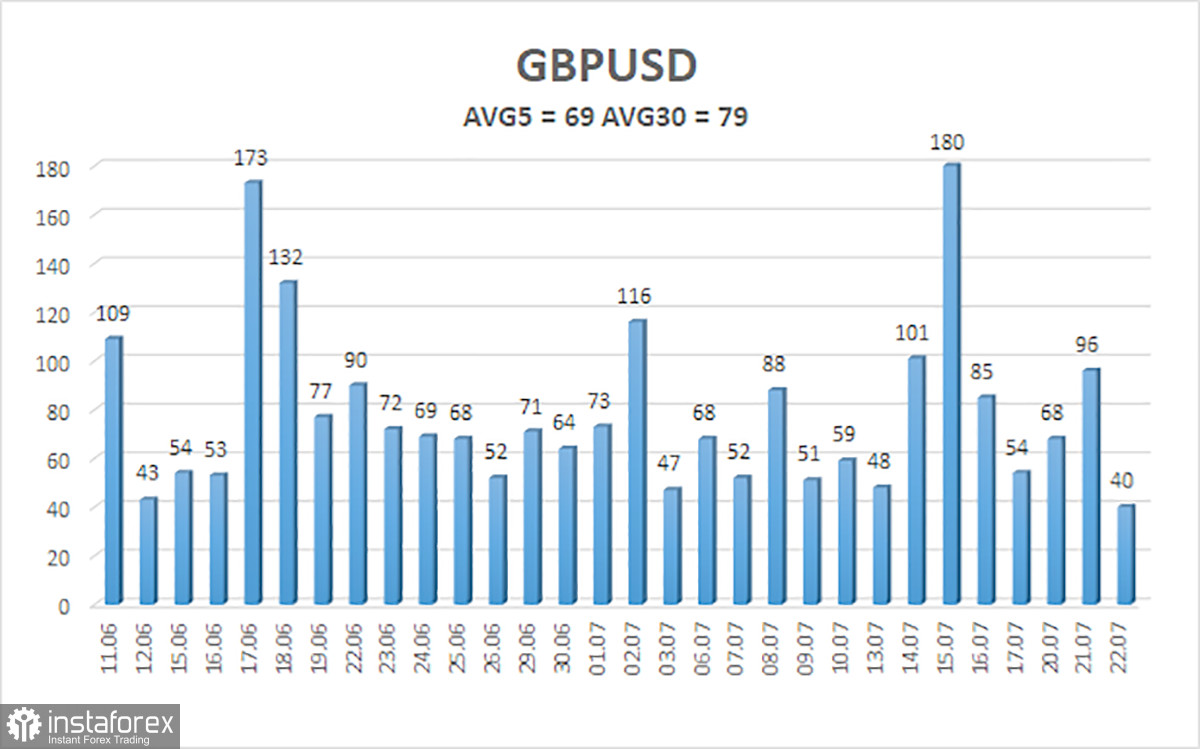
The average volatility of the GBP/USD pair over the last 5 trading days as of July 23 is 69 pips. For the pound/dollar pair, this value is considered "average." Therefore, on Thursday, July 23, we expect the pair to move within the range limited by levels 1.3296 and 1.3434. The upper linear regression channel is pointing downward, indicating a bearish trend. The CCI indicator has formed a bearish divergence and entered the overbought area, signaling the start of a downward correction.
S1 – 1.3367
S2 – 1.3306
S3 – 1.3245
R1 – 1.3428
R2 – 1.3489
R3 – 1.3550
The GBP/USD currency pair maintains a downward trend, which is presumably a correction within a global upward trend, as clearly seen on the daily or weekly timeframe. The global fundamental backdrop for the dollar remains negative, but 2026 appears super-positive for the dollar due to geopolitical factors, although every fairy tale comes to an end. However, the weekly timeframe remains flat between 1.3150 and 1.3780 within a four-year upward trend, allowing for expectations of a continuation of growth for the British currency in the medium term. Long positions with targets of 1.3489 and 1.3550 can be considered when the price is above the moving average. When the price is below the moving average line, bearish positions can be considered with targets of 1.3306 and 1.3296.
Linear regression channels help determine the current trend. If both are directed in one direction, it indicates that the trend is currently strong;
The moving average line (settings 20,0, smoothed) defines the short-term trend and the direction in which trading should currently be conducted;
Murray levels are target levels for movements and corrections;
Volatility levels (red lines) represent the likely price channel in which the pair will spend the next day, based on current volatility metrics;
The CCI indicator's entry into the oversold area (below -250) or the overbought area (above +250) means that a trend reversal is approaching in the opposite direction.


