یہ بھی دیکھیں

 25.06.2026 04:30 AM
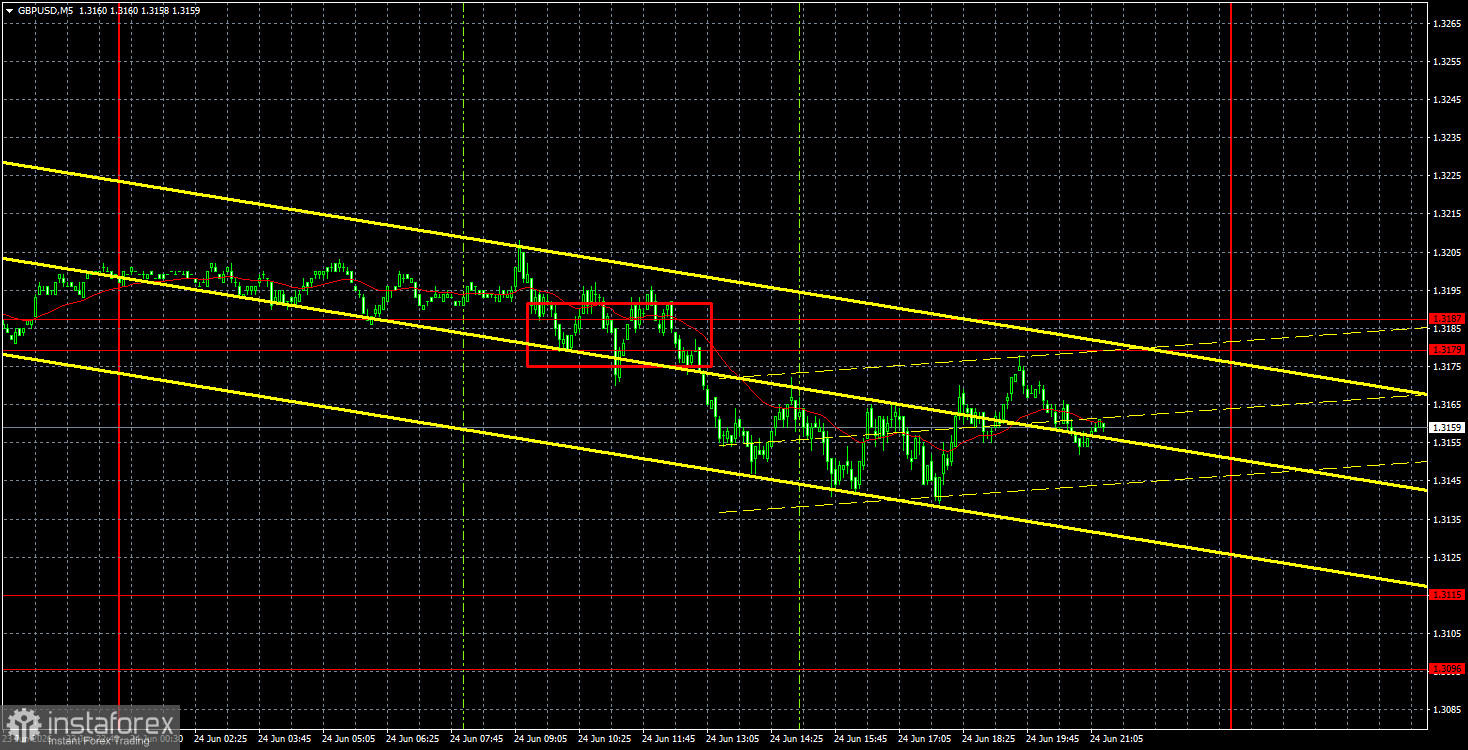
The GBP/USD currency pair resumed its downward movement on Wednesday. Discussing the reasons for the new decline of the British pound is meaningless, as there are none. The decline has been occurring almost daily, even when there are no significant events or reports. Therefore, while it was still possible to assume a negative market reaction to the UK business activity indices on Tuesday, that excuse was no longer valid on Wednesday. It cannot be said that the British pound has fallen significantly. However, the decline is steady and nearly daily. We consider it illogical, inertial, and speculative. Simply put, the market is selling GBP/USD because the pair is declining, and the pair is declining because the market is selling it. A vicious cycle. In our opinion, we should not expect any significant event to stop the bears. The bears will stop when the time comes. And nobody knows when that time will be. Market makers do not report to retail traders. Therefore, we can only follow the technical picture and the majority's opinion while keeping in mind the illogicality of what is happening.
From a technical standpoint, the downward trend has resumed, as the market aggressively bought the dollar over two consecutive days last week. The area of 1.3179-1.3187 halted the British currency's decline for a few days, but ultimately could not withstand the pressure from above. The decline may continue for technical reasons. There is an obvious trend, so the market may continue to sell the pair based on this trend.
On the 5-minute timeframe on Wednesday, one sell signal was generated. During the European trading session, the price broke through the 1.3179-1.3187 area, but by the end of the day, it failed to show a strong decline. However, the decline may continue today, Thursday, even if there are no significant reasons for it. Short position traders could earn a few dozen pips in any case.

COT reports for the British pound show that, in recent years, commercial traders' sentiment has been constantly changing. The red and blue lines, which reflect the net positions of commercial and non-commercial traders, frequently cross and are usually close to the zero mark. Currently, the lines are moving apart, and non-commercial traders still dominate with... sales. Given the events in the Middle East, it is not surprising that demand for risk currencies is low.
In the long term, the dollar continues to decline due to Donald Trump's policies, as is clearly visible on the weekly timeframe (illustration above). The trade war will continue in one form or another for a long time, and Trump's policies are aimed directly and indirectly at weakening the American currency. However, geopolitical factors are currently paramount, having recently provided strong support to the dollar. Since the conflict in the Middle East is not yet resolved, the U.S. dollar may still see growth. According to the latest COT report (dated June 9), the "Non-commercial" group closed 7,900 BUY contracts and opened 4,000 SELL contracts. Consequently, the net position of non-commercial traders decreased by 11,900 contracts over the week.
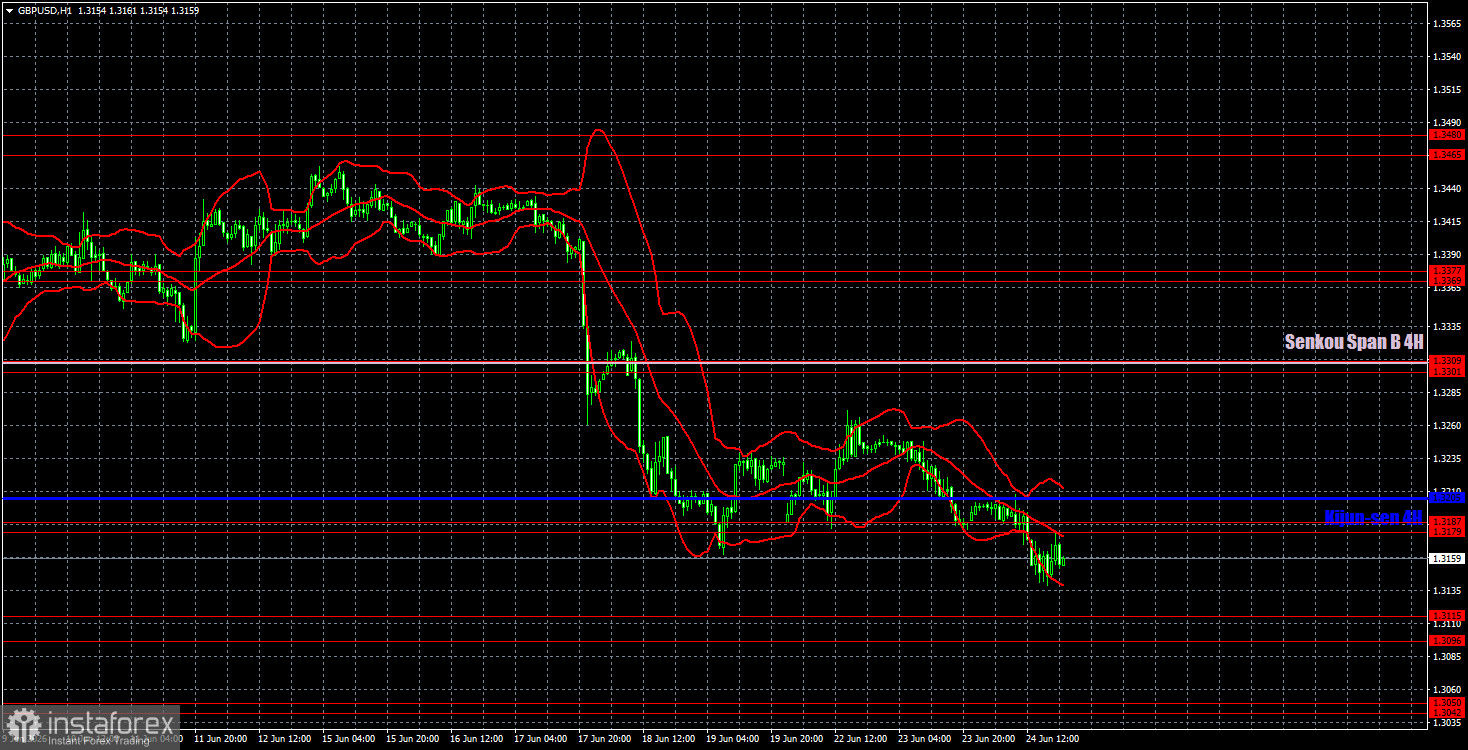
On the hourly timeframe, the GBP/USD pair has resumed its downward trend, which does not align with the current fundamental and geopolitical context. However, for three months, the market has ignored both fundamentals and macroeconomics and is now responding selectively to geopolitics. We do not believe the British pound warrants such a sharp decline.
For June 25, we highlight the following important levels: 1.3042-1.3050, 1.3096-1.3115, 1.3179-1.3187, 1.3301-1.3309, 1.3369-1.3377, 1.3465-1.3480, 1.3588, 1.3671-1.3681. The Senkou Span B (1.3310) and Kijun-sen (1.3205) lines can also serve as signal sources. It is recommended to set the Stop Loss to breakeven once the price has moved in the correct direction by 20 pips. The Ichimoku indicator lines may move during the day, which should be taken into account when determining trading signals.
On Thursday, there are no significant reports or events scheduled in the UK, while in the U.S., reports on durable goods orders, first-quarter GDP, and the core PCE price index will be released. These reports may influence market sentiment, but they are unlikely to have a significant impact.
Today, traders may consider short positions targeting 1.3096-1.3115 if the pair bounces from the 1.3179-1.3187 area from below. Long positions will become relevant after consolidation above the 1.3179-1.3187 area, targeting 1.3301-1.3309.
Support and resistance price levels are thick red lines around which movement may end. They are not sources of trading signals.
The Kijun-sen and Senkou Span B lines are Ichimoku indicator lines transferred from the 4-hour timeframe to the hourly timeframe. They are strong lines.
Extreme levels are thin red lines from which the price has previously bounced. They are sources of trading signals.
Yellow lines indicate trend lines, trend channels, and any other technical patterns.
Indicator 1 on the COT charts shows the size of the net position of each category of traders.


