یہ بھی دیکھیں

 10.03.2026 04:32 AM
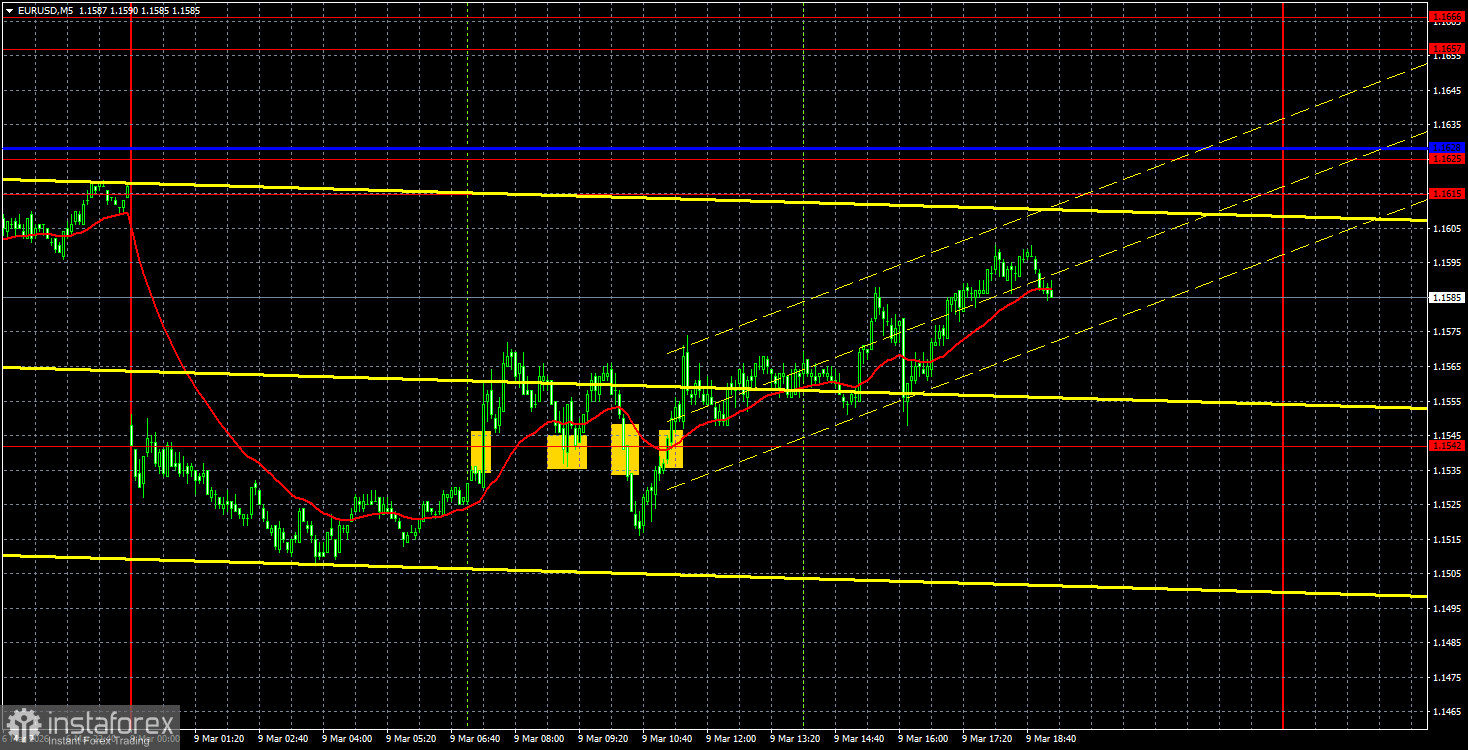
The EUR/USD currency pair had a challenging trading day on Friday. The day started with a new collapse and a gap; however, throughout the day, the European currency made another attempt to rise from the lows. It's fair to say it didn't perform well, but it managed to recover most of its losses. Over the weekend, news emerged that Donald Trump is quite open to the idea of conducting a ground operation in Iran, as achieving the set goals seems quite problematic through other means. The market's reaction to this news was telling. Once again, the dollar rose on geopolitical factors, and oil prices nearly set a new record. Only the easing of tensions in the afternoon permitted the euro to recover, with oil prices dropping to at least $95-$100 per barrel. However, the markets remain nervous and agitated.
On the hourly timeframe, the downward trend remains unchanged; the movements in the past few days have been choppy and nervous. Traders will have to rely solely on the Kijun-sen lines, as a suitable trend line cannot be formed at this time. Therefore, a consolidation above the critical line will allow for expectations of growth at least to the Senkou Span B line. Only a breakout above the Senkou Span B will give the euro any hope of more than a correction.
On the 5-minute timeframe, the price frequently reversed throughout the day, resulting in numerous similar trading signals. Essentially, all signals formed around the 1.1542 level, and the first three were false. Only the fourth signal could have yielded profits, but it became pointless to act on it. There were no losses on the first two trades, as in both cases, the price moved in the required direction by at least 15 pips.
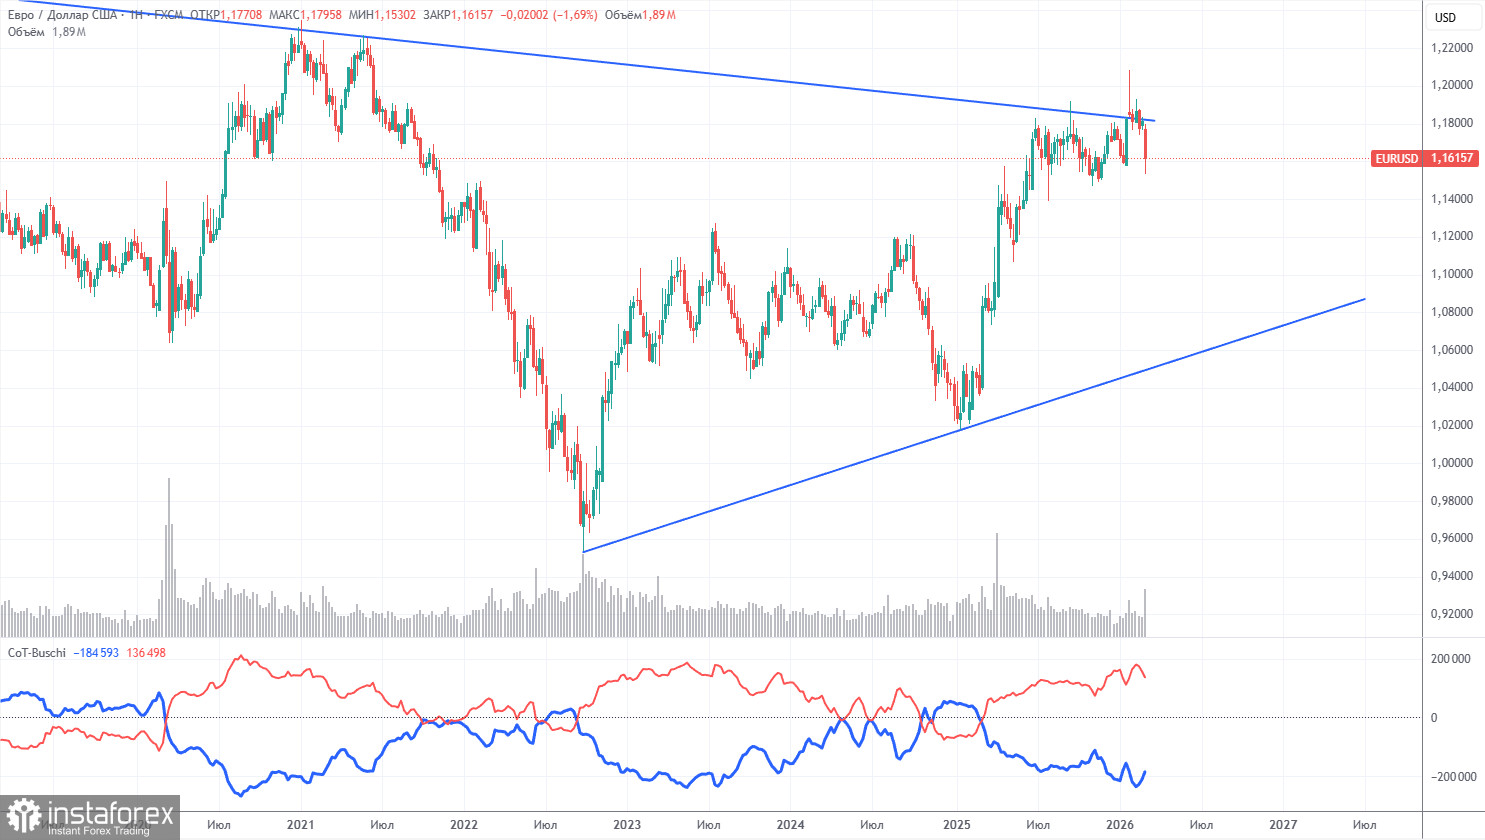
The latest COT report is dated March 3. The illustration of the weekly timeframe clearly shows that the net position of non-commercial traders remains "bullish," and since Trump took office as President of the U.S. for the second time, only the dollar has been falling. We cannot claim with 100% certainty that the decline of the American currency will continue, but current developments around the world suggest this is a possibility.
We still do not see any fundamental factors that would strengthen the European currency, even amid the war in the Middle East. Conversely, there are enough factors indicating a decline for the American dollar. The global downward trend remains, but what matters now is not where the price has moved in the last 18 years. Since September 2022, a new upward trend has been forming, breaking the global descending trend line. Thus, the path further upward is open.
The positioning of the red and blue lines of the indicator continues to indicate the persistence of a "bullish" trend. Over the last reporting week, the number of longs in the "Non-commercial" group decreased by 300, while the number of shorts increased by 20,000. Consequently, the net position has decreased by 20,300 contracts over the week.
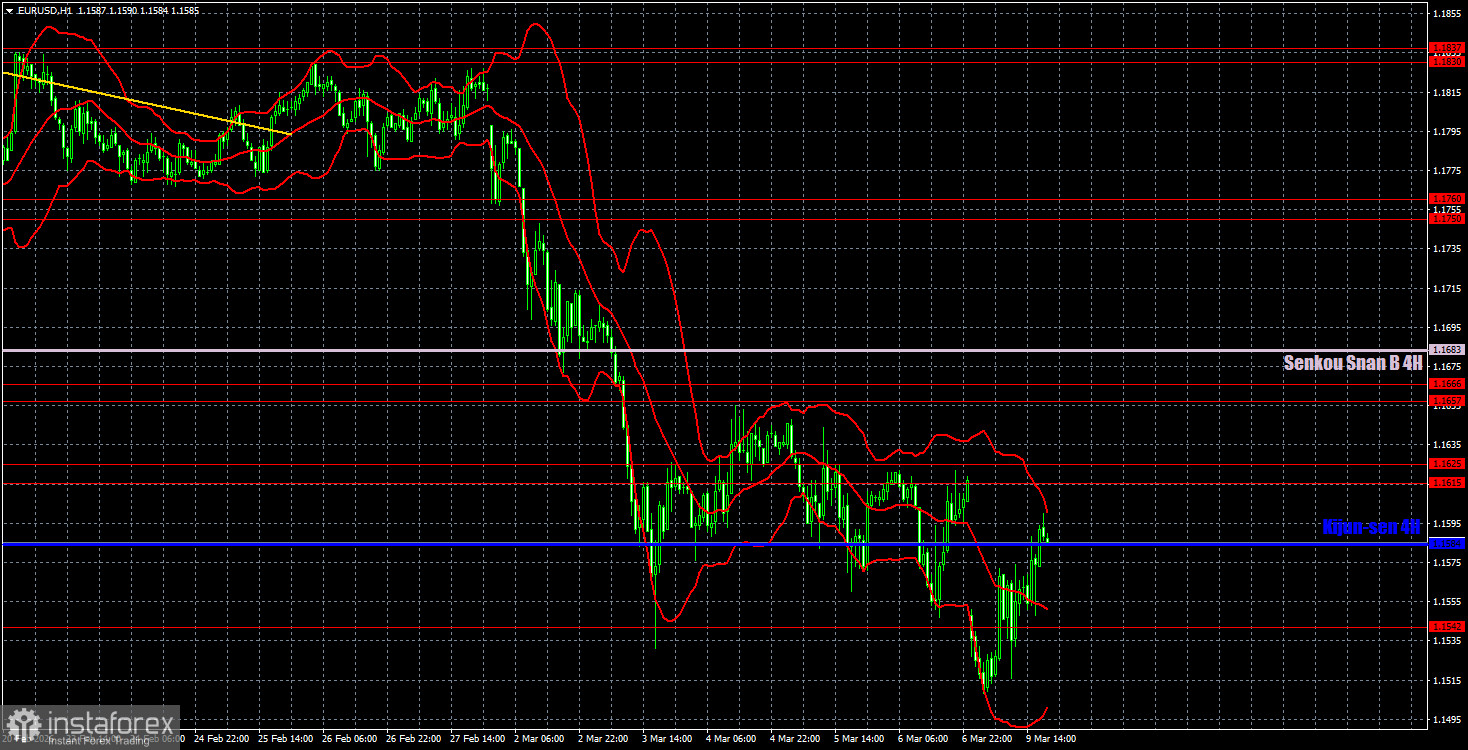
On the hourly timeframe, the EUR/USD pair continues to show a new downward trend amid geopolitical events in the Middle East. How long the dollar will continue to rise solely on this factor remains unclear, as it will depend on the intensity and duration of the war, losses on both sides, the U.S.'s ability to achieve its goals, and the consequences for the global economy. However, at this time, we have a downward trend.
For March 10, we identify the following levels for trading: 1.1362, 1.1426, 1.1542, 1.1615-1.1625, 1.1657-1.1666, 1.1750-1.1760, 1.1830-1.1837, 1.1907-1.1922, 1.1971-1.1988, as well as the Senkou Span B line (1.1683) and Kijun-sen line (1.1584). The Ichimoku indicator lines may shift throughout the day, which should be taken into account when determining trading signals. Don't forget to set Stop Loss orders to breakeven if the price moves in the correct direction by 15 pips. This will safeguard against possible losses if the signal turns out to be false.
On Tuesday, only the German trade balance report is scheduled for publication in the Eurozone, while in the U.S., only minor reports, such as ADP (weekly variation) and existing home sales, will be released. Macroeconomics will again have no influence on the pair's movements. All attention is once again on geopolitics.
On Tuesday, traders may consider short positions in the event of a rebound from the 1.1615-1.1625 area or the critical line, targeting 1.1542. Long positions can be considered if the price consolidates above the 1.1615-1.1625 area, with targets at 1.1657-1.1666 and the Senkou Span B line.
Price levels of support and resistance – thick red lines near which the movement may end. They are not sources of trading signals.
Kijun-sen and Senkou Span B lines – lines of the Ichimoku indicator transferred to the hourly timeframe from the 4-hour timeframe. They are considered strong lines.
Extremum levels – thin red lines from which the price has previously bounced. They are sources of trading signals.
Yellow lines – trend lines, trend channels, and any other technical patterns.
Indicator 1 on COT charts – the size of the net position for each category of traders.


