
यह भी देखें


 21.10.2026 05:10 AM
The EUR/USD pair traded quietly again on Tuesday and still cannot overcome the Senkou Span B line—in fact, it doesn't even try. We saw a small correction after a month of euro weakness, but that recovery looks more like a routine pullback ahead of further declines. Despite the euro's uninterrupted decline for a month, the market still sees no reasons to buy the euro or to take profits on long positions on the dollar. Even the pound has risen for four consecutive days while the euro has not. Note that the European Central Bank has already raised key rates twice, whereas the Bank of England is only about to begin tightening. Yesterday German and euro-area sentiment readings disappointed, yet the market is clearly not trading on such secondary data. Because unrest continues in France and some other EU countries, the market is reluctant to buy the euro. In our view, rising sovereign yields, a sell-off in bond markets and protests against governments are not surprising in 2026 — the U.S. shows similar tensions. Therefore, the euro remains weak without strong fundamental justification.
Technically, the downtrend may be complete because the trendline has been breached. For five straight weeks the market bought the dollar on any pretext, but every story ends. The euro is now heading for the Senkou Span B line. We believe price should clear that line and begin a sustained uptrend.
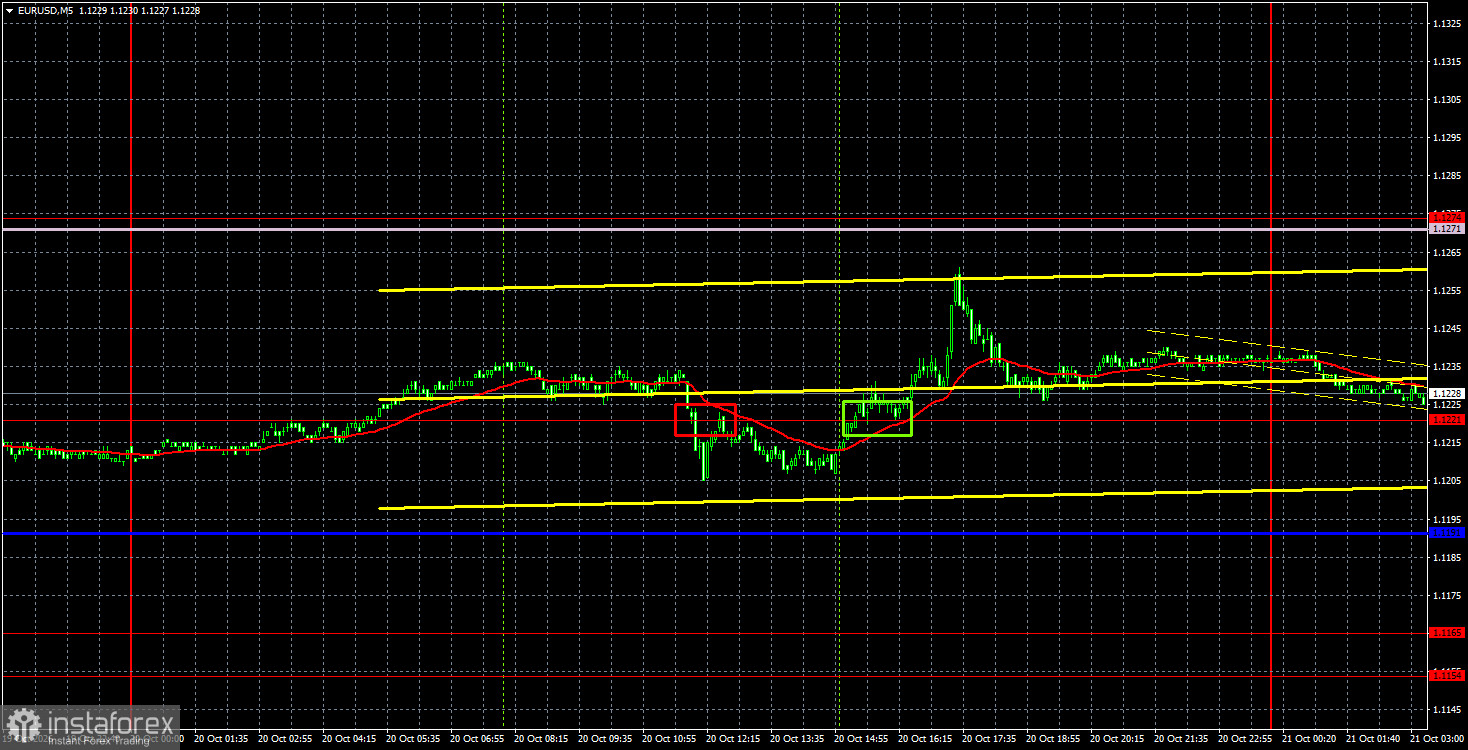
On the 5-minute chart, Tuesday produced two trading signals. Price first closed below 1.1221 but could not develop a sustained downward move. Later it broke 1.1221 from below to above, but that did not produce strong gains either. The second buy trade could, however, have yielded a small profit for traders.
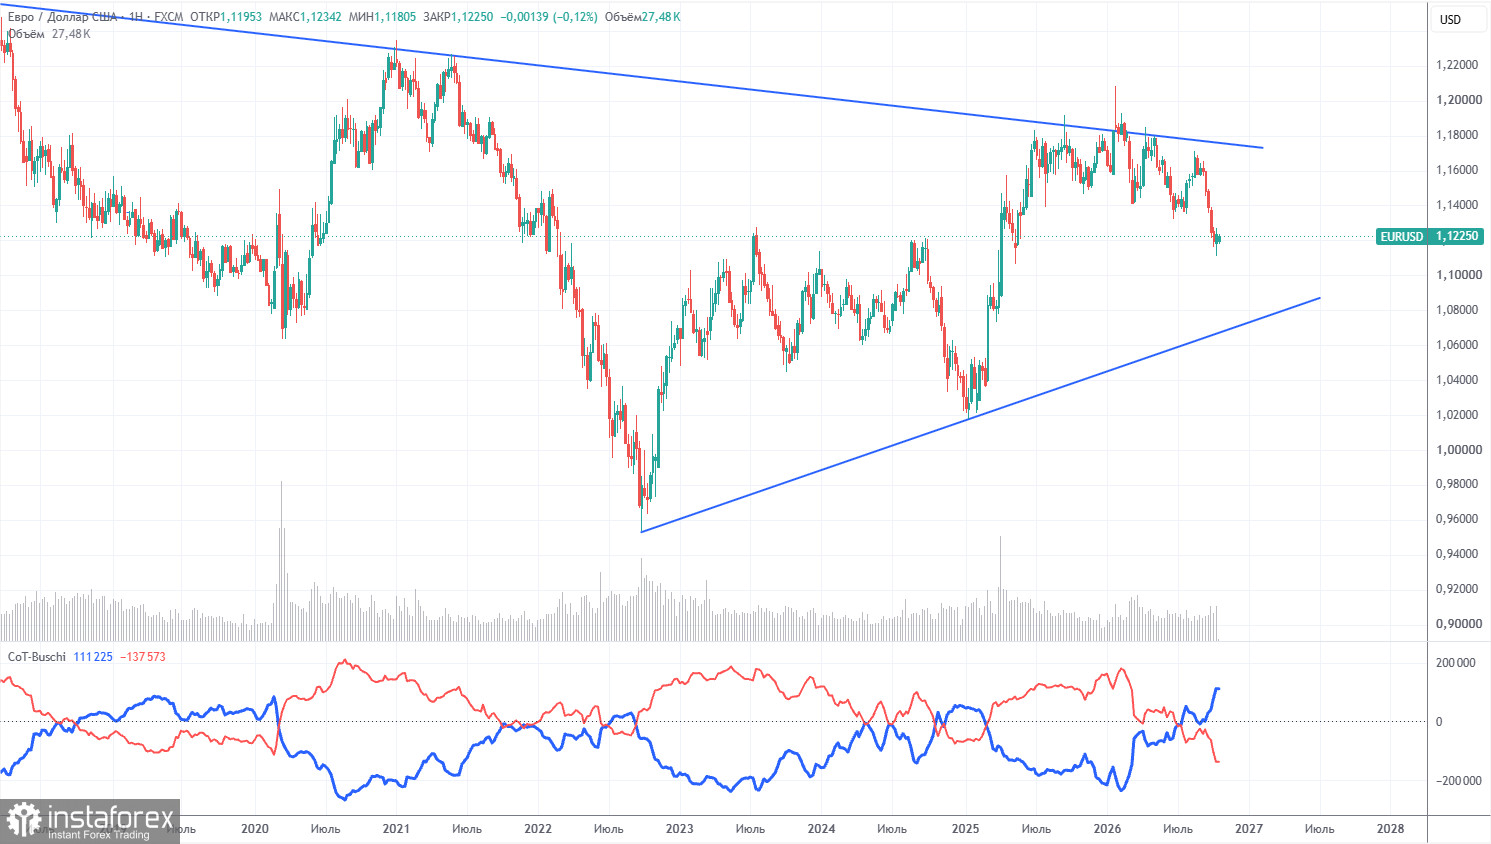
The latest COT report is dated October 13. The weekly chart shows that non-commercial traders' net position remains bearish and has declined substantially in 2026 due to geopolitical events. Over the past eight months, traders have reduced euro exposure in favor of the US dollar. Donald Trump's policies have not changed, but the dollar has served as a "reserve" currency for a time.
However, we still see no fundamental basis for further long-term strengthening of the US dollar. The war in the Middle East made the dollar temporarily very attractive, and the Federal Reserve's monetary stance surprised the dollar for the second time this year. In the long run, the euro could fall to $1.08 (the trendline), but the uptrend will remain relevant. Recently, the market has incorporated only dollar-positive factors and ignored everything else.
The positioning of the red and blue indicator lines points to the bears' advantage. Last reporting week, long positions in the "Non-commercial" group fell by 20,100, while shorts rose by 18,200. Accordingly, net non-commercial positions fell by another 38,300 contracts over the week.
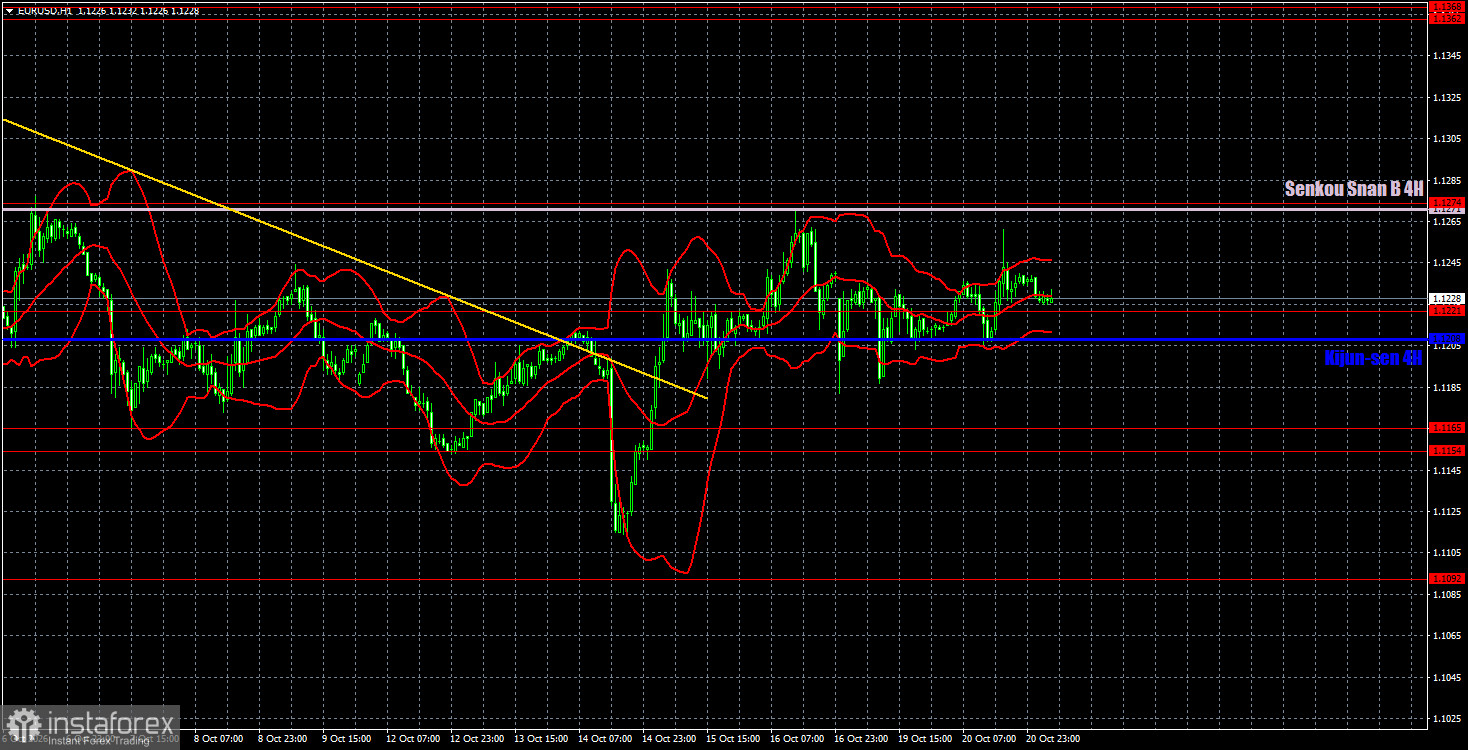
On the hourly timeframe, the EUR/USD pair finally has the opportunity to form an uptrend. Looking at the daily and weekly timeframes, the odds of a strong, lasting trend remain high. Throughout 2026, "black swans" boosted the dollar, arriving in waves. However, any long-term rise in the dollar is effectively a correction. Perhaps that correction has now ended?
For October 21 we highlight the following trading levels — 1.1092, 1.1154–1.1165, 1.1221, 1.1274, 1.1362–1.1368, 1.1461–1.1473, 1.1536–1.1542, 1.1585, 1.1657–1.1665, and the Ichimoku lines Senkou Span B (1.1271) and Kijun-sen (1.1208). Ichimoku lines may shift during the day, so take that into account when defining signals. Don't forget to move your stop-loss to breakeven once price has moved 15 pips in the intended direction; that will protect against potential losses if a signal proves false.
On Wednesday, ECB President Christine Lagarde will speak in the eurozone, while no notable events are scheduled in the US. Lagarde's remarks could either disappoint or inspire the market, although traders have recently persistently discounted the ECB-tightening factor.
Traders may consider short positions around 1.1154–1.1165 and 1.1092 if price closes below the 1.1208–1.1221 area. If price rebounds from the 1.1208–1.1221 area, consider long positions in the 1.1271–1.1274 zone.

