
यह भी देखें


 23.07.2026 04:40 AM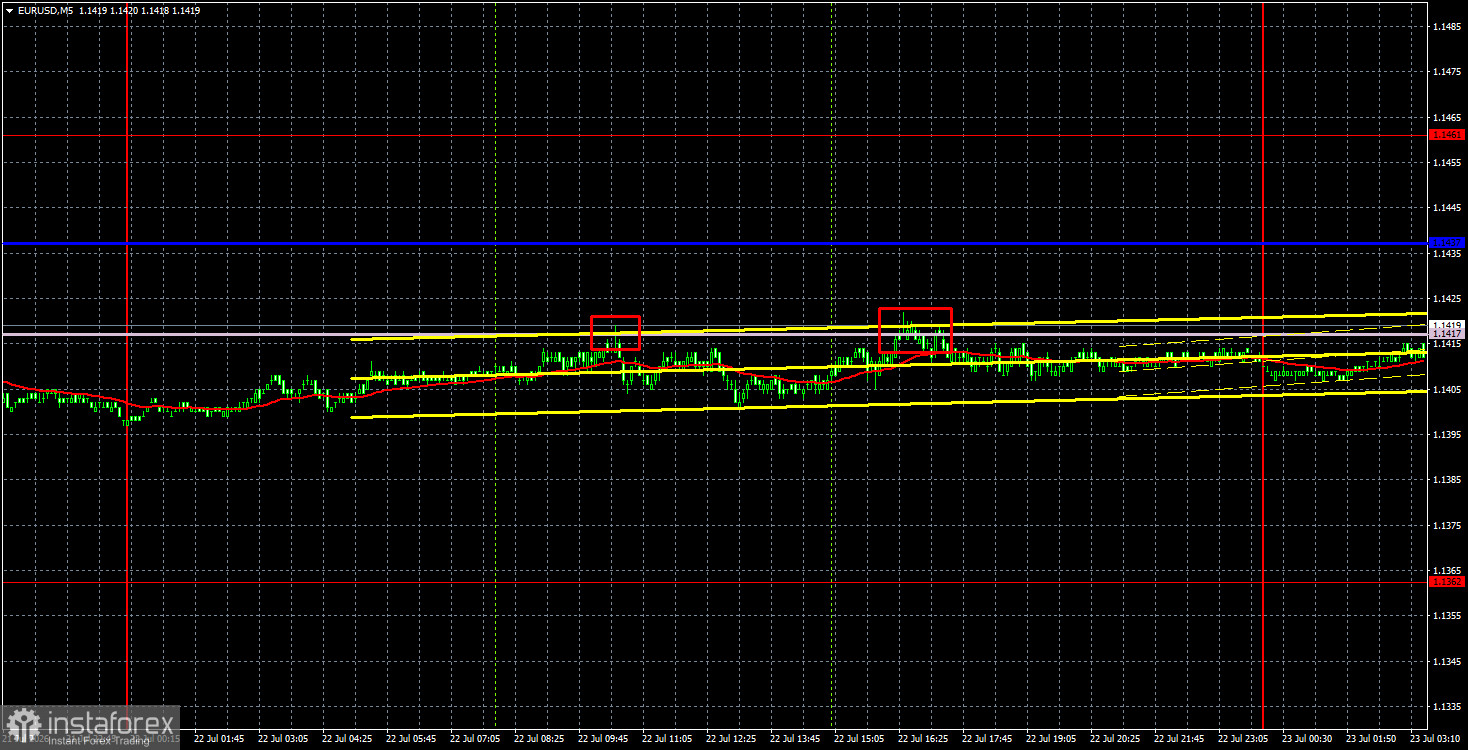
The EUR/USD currency pair continued to trade on Wednesday as if it were doing someone a favor. Volatility was again minimal, and for the fourth consecutive week, the price remains in a weak upward correction that borders on a flat trend. We believe that the current movement should be viewed as a flat, as the euro spends most of its time within the horizontal channel of 1.1362-1.1461. Thus, after reaching the upper boundary of this channel, movement toward the lower boundary has begun, which we have been observing for several consecutive days. Given the weakness of the movements and the presence of a flat, we do not believe that any fundamental, macroeconomic, or geopolitical factors are currently impacting the market. Individual events may provoke market reactions, but they are so weak that it is unclear whether they are market noise or actual reactions. Yesterday, there were no reports published in the Eurozone, Germany, or the US, and no fundamental events occurred. The market had nothing to react to throughout the day.
From a technical perspective, the pair maintains a slight upward bias, yet this trend is effectively a flat. The price has returned to the horizontal channel of 1.1362-1.1461, and the upward movement in recent weeks has been so weak that it is difficult to discuss it as a trend. In a flat, the Ichimoku indicator lines are weak. Volatility remains low.
On the 5-minute timeframe on Wednesday, the price bounced off the Senkou Span B line twice and seemingly formed two sell signals. However, what is the point of these signals if the price moved sideways throughout the day, with an overall volatility of 25 pips? If there are no movements, any signals will not yield profits.
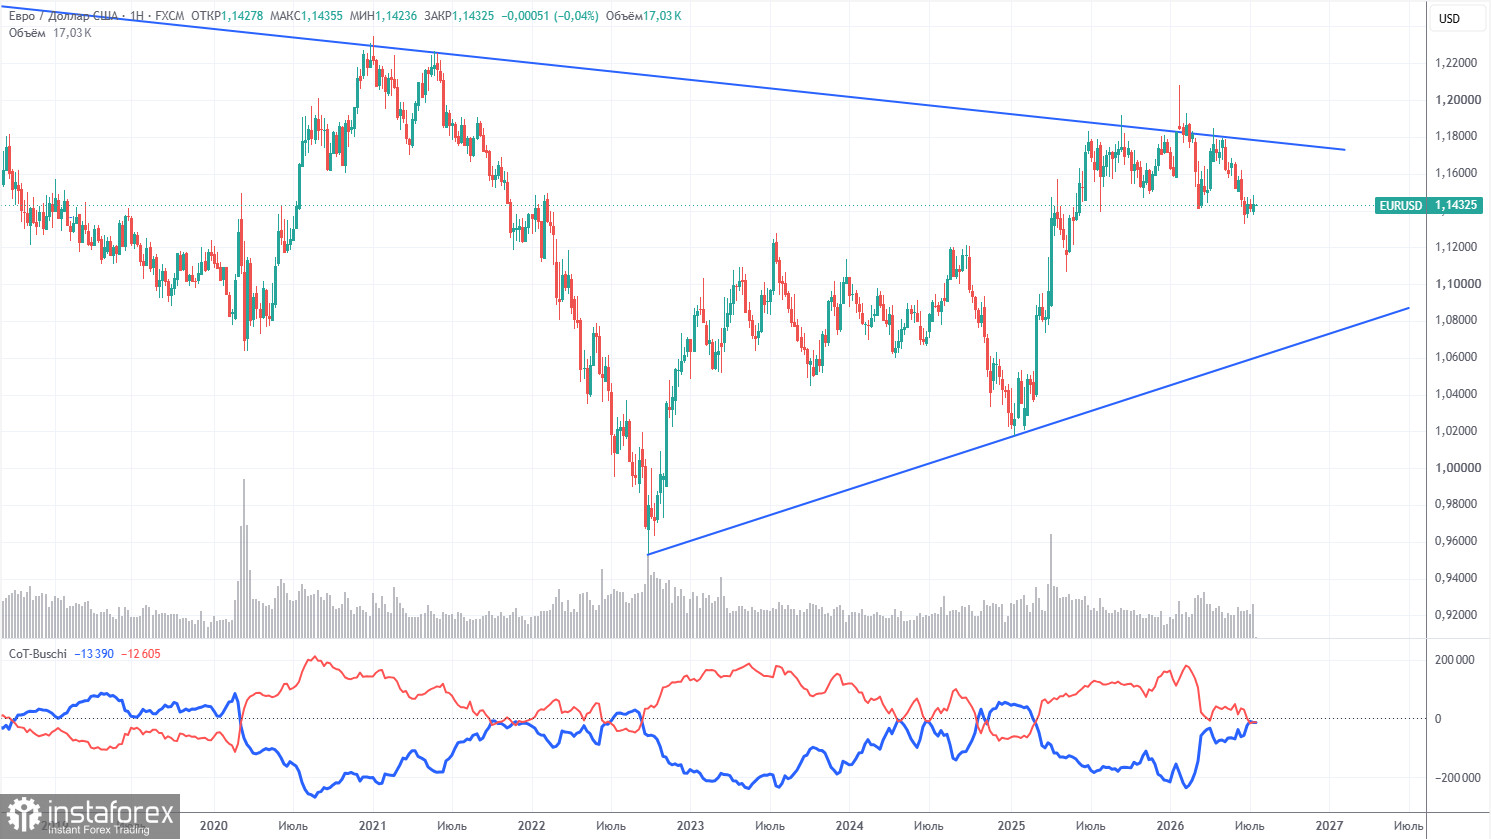
The latest COT report is dated July 14. The illustration on the weekly timeframe shows that the net position of non-commercial traders remains bullish, but has significantly decreased due to geopolitical events. Traders have been getting rid of the European currency in favor of the US dollar in recent months. Donald Trump's policy has not changed, but the dollar has acted as a "reserve currency" for some time. However, this process may have already come to an end.
We still do not see any fundamental factors for the strengthening of the euro, while sufficient factors for the decline of the US dollar remain. The war in the Middle East has made the dollar temporarily super-attractive, but when this factor reaches its "expiration date," everything will return to normal. And that expiration may have already come. In the long term, the euro could fall to as low as 1.08$ (the trend line), but the upward trend will still remain relevant. Over the past months of dollar growth, the pair has not moved significantly closer to this line.
The positioning of the red and blue lines of the indicator indicates parity between bulls and bears. During the last reporting week, the number of long positions in the "Non-commercial" group increased by 6,900, while the number of shorts increased by 3,300. Accordingly, the net position increased by 3,600 contracts over the week.
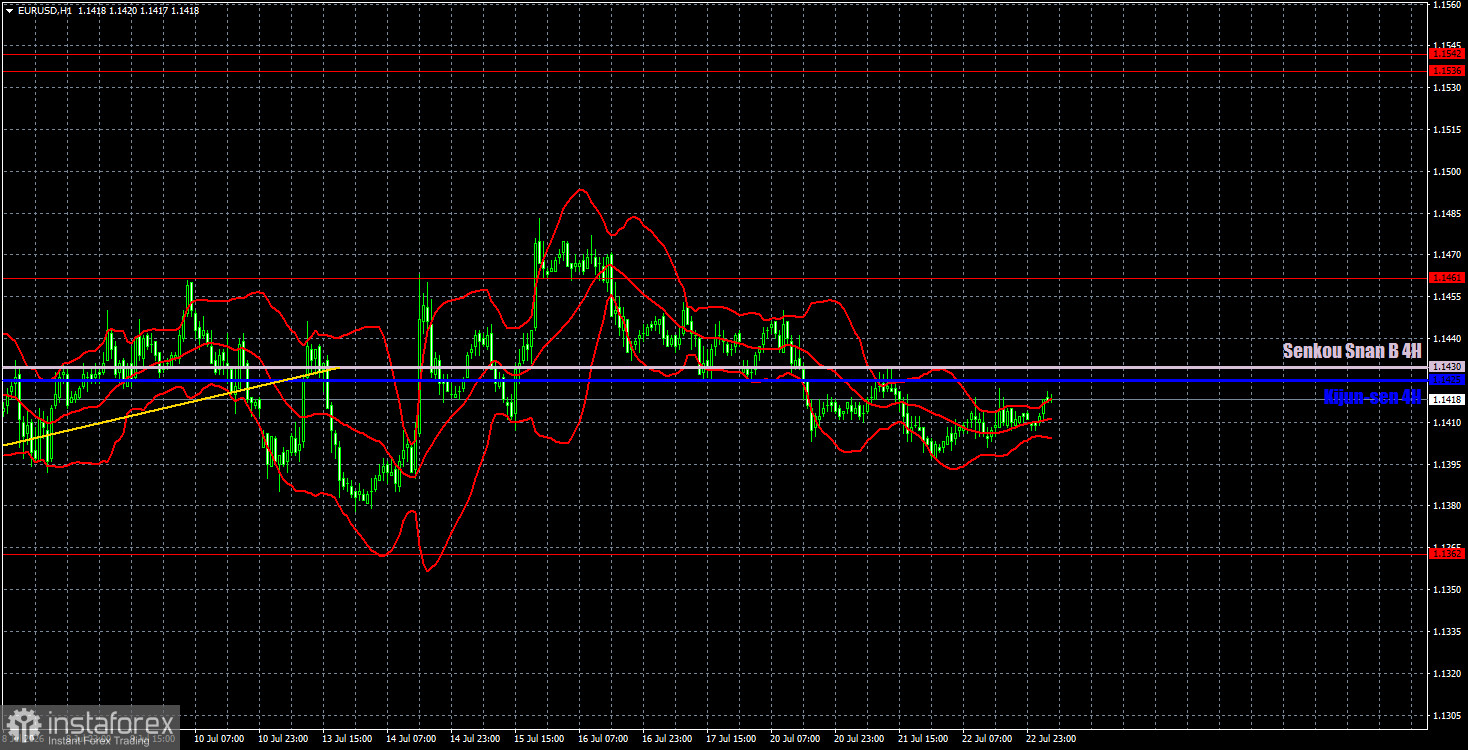
On the hourly timeframe, a corrective upward trend continues to form, which is essentially a flat. The situation in the Middle East remains tense and has not improved. The market continues to ignore many factors in favor of the euro, preventing the European currency from showing any significant growth. However, in recent weeks, the dollar has also failed to show growth. The market is simply stagnant.
For July 23, we highlight the following trading levels — 1.1234, 1.1274, 1.1362, 1.1461, 1.1536-1.1542, 1.1585, 1.1657-1.1666, 1.1750-1.1760, 1.1786, 1.1830-1.1837, as well as the Senkou Span B line (1.1430) and Kijun-sen (1.1425). The lines of the Ichimoku indicator may move during the day, which should be considered when determining trading signals. Remember to set a Stop Loss order to breakeven if the price moves in the right direction by 15 pips. This will protect against potential losses if the signal turns out to be false.
On Thursday, the European Central Bank meeting will take place in the Eurozone, which the market is ignoring, and it is expected that rates will remain unchanged with a probability of 90%. In the US, there will be a report on jobless claims, which is not expected to have a significant impact. Therefore, we are unlikely to see strong movements today or the end of the flat.
Today, traders may consider short positions targeting 1.1362 if the price bounces from the area of the Senkou Span B and Kijun-sen lines. Long positions can be opened with targets of 1.1461 and 1.1480 if the pair consolidates above the Senkou Span B line. It should be remembered that there are currently virtually no movements in the market.
Support and resistance levels are represented by thick red lines, around which price movement may end. They are not sources of trading signals.
The Kijun-sen and Senkou Span B lines are Ichimoku indicator lines transferred to the hourly timeframe from the 4-hour timeframe. They are strong lines.
Extreme levels are represented by thin red lines from which the price has previously bounced. They are sources of trading signals.
Yellow lines are trend lines, trend channels, and any other technical patterns.
Indicator 1 on COT charts represents the size of the net position of each category of traders.

