यह भी देखें

 11.03.2026 06:41 AM
[Gold]
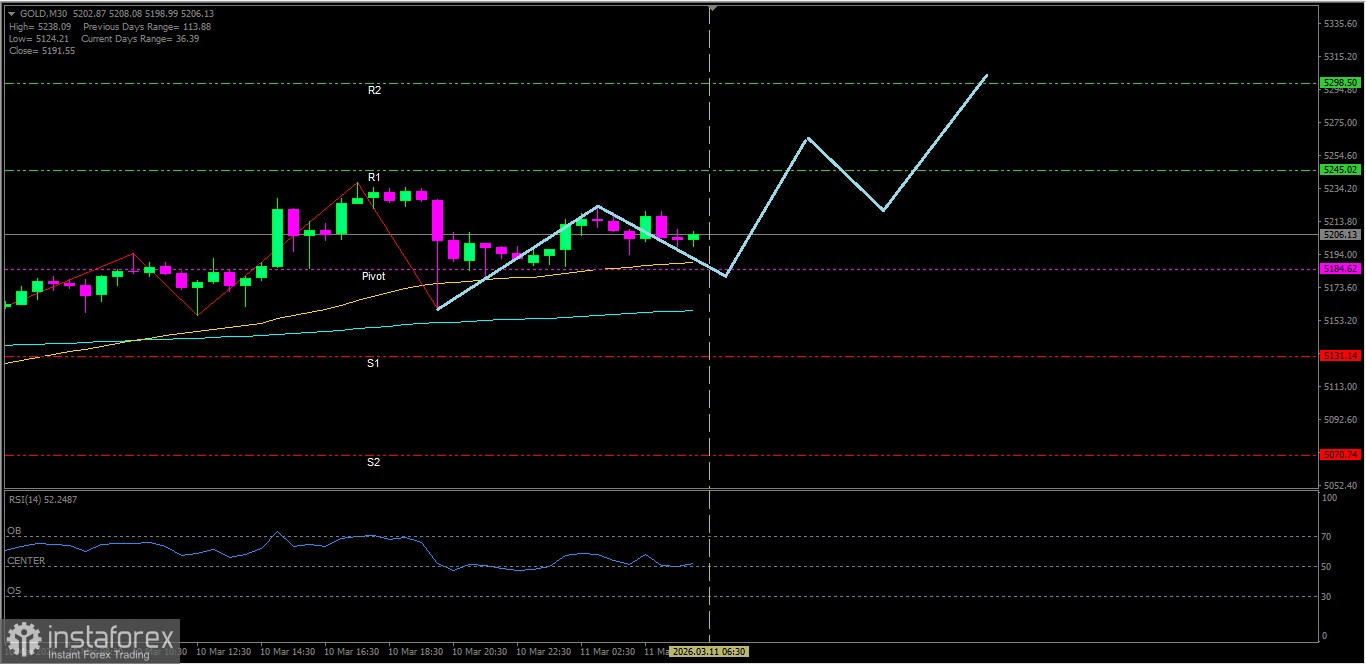
With EMA(50) and EMA(200) condition in a Golden Cross intersection and RSI(14) indicator in the Neutral-Bullish area, then Gold is likely to test its nearest resistance level in the near term.
Key Levels
1. Resistance. 2 : 5298.50
2. Resistance. 1 : 5245.02
3. Pivot : 5184.62
4. Support. 1 : 5131.14
5. Support. 2 : 5070.74
Tactical Scenario
Positive Reaction Zone: If the price holds at 5184.62, Gold is likely to move up toward 5245.02.
Momentum Extension Bias: If 5245.02 is broken, Gold could continue higher to test 5298.50.
Invalidation Level / Bias Revision
The upside bias weakens if Gold falls below 5070.74.
Technical Summary
EMA(50) : 5188.51
EMA(200): 5159.06
RSI(14) : 50.54
Economic News Release Agenda:
Today the United States will release the following economic data:
US - Core CPI m/m - 19:30 WIB
US - CPI m/m - 19:30 WIB
US - CPI y/y - 19:30 WIB
US - Crude Oil Inventories - 21:30 WIB
US - 10-y Bond Auction - 00:01 WIB
US - Federal Budget Balance - 01:00 WIB
You have already liked this post today
*यहां पर लिखा गया बाजार विश्लेषण आपकी जागरूकता बढ़ाने के लिए किया है, लेकिन व्यापार करने के लिए निर्देश देने के लिए नहीं |

