আরও দেখুন

 21.01.2026 03:49 AM
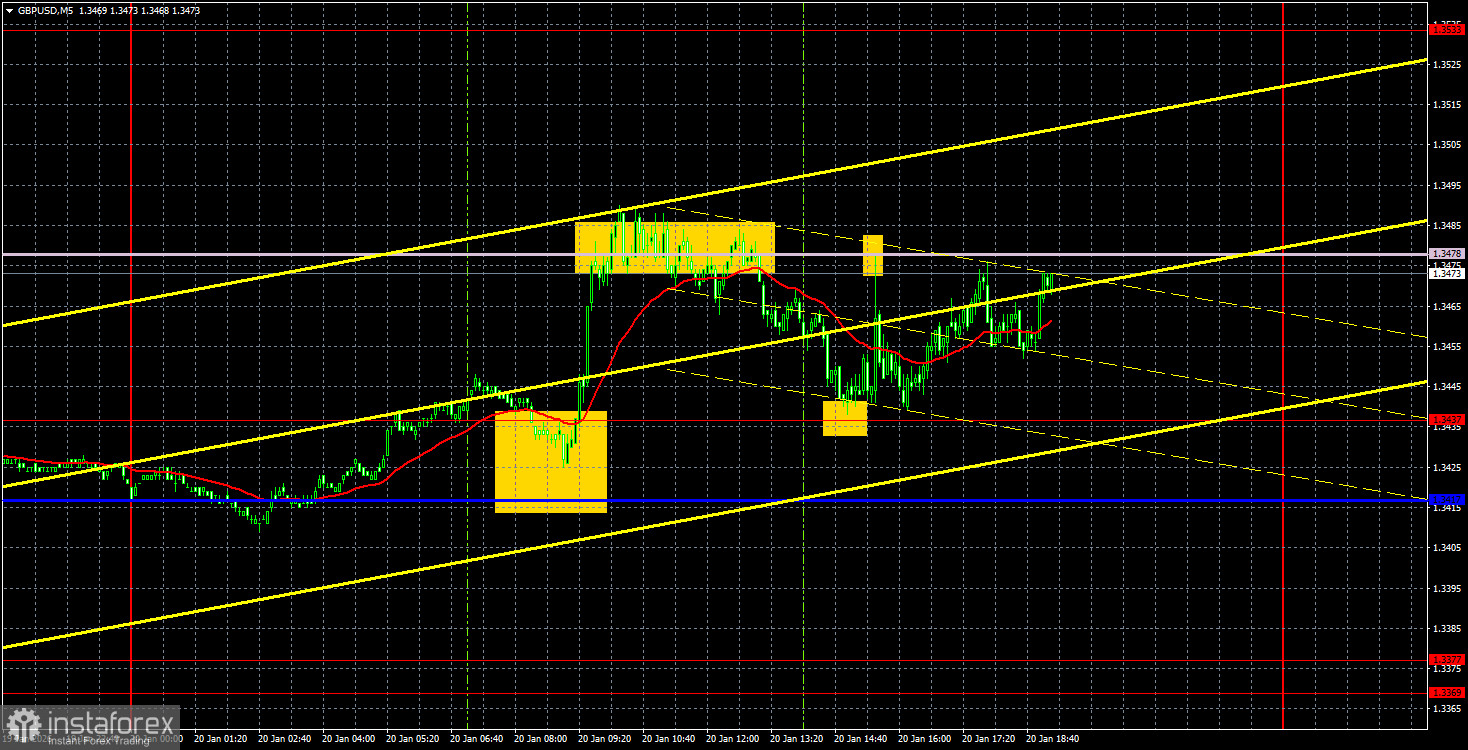
The GBP/USD currency pair also traded higher on Tuesday, but much more modestly. The Senkou Span B line could not be overcome by the end of the day, which restrains further gains in the British currency. However, the trendline was breached, so we support further upside for the pair. The reasons for this rise are obvious and have been actively accumulating over the past six months. Recall that the market has not fully priced in the US "shutdown" (and a new "shutdown" could begin on February 1), three Fed easing moves, Trump's autumn tariffs, winter military threats and US incursions, criminal proceedings against Jerome Powell, and a stagnating labour market. Therefore, further dollar weakness (and pound strength) would be entirely logical.
From a technical standpoint, it is best to revisit the daily timeframe. Price continues to trade above the Ichimoku cloud and above the critical line. On the hourly timeframe, the short-term trend has switched to upward. There are currently no grounds to expect a near-term decline in the pound. At the end of the month, the Fed meeting. The key rate will likely remain unchanged, but the 2026 rhetoric may remain dovish given US labour-market conditions and fairly low US inflation.
On the 5-minute TF, the pair spent most of Tuesday trading between the 1.3437 level and the Senkou Span B line. Each rebound from that level and the line could be worked by traders. In all cases, the opposite target was achieved. Thus, by conservative estimates, you could have opened four trades, each yielding about 20–25 pips.
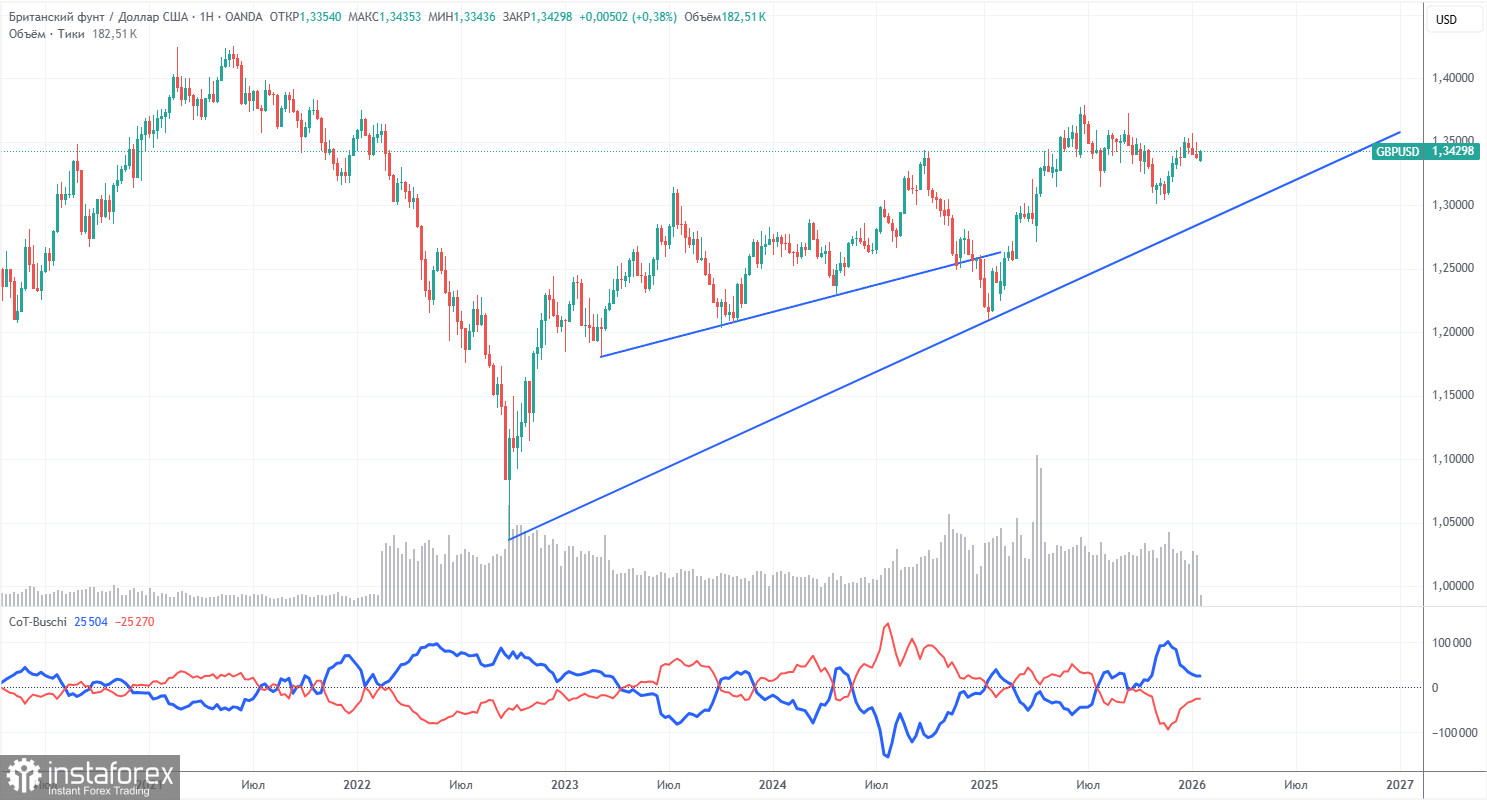
COT reports for the British pound show that commercial traders' sentiment has repeatedly changed in recent years. The red and blue lines, reflecting net positions of commercial and non-commercial traders, constantly cross and, in most cases, are close to zero. At the moment, the lines are converging, and non-commercial traders dominate with... sales. Lately, speculators have begun to build long positions, so a shift in sentiment may occur soon, which does not significantly affect GBP/USD in the current context.
The dollar continues to decline due to Donald Trump's policies, as shown in the weekly TF (illustration above). The trade war will continue in one form or another for a long time, and the Fed will, in any case, cut rates within the next 12 months. Demand for the dollar will fall. According to the latest COT report (dated January 13) for the pound, the "Non-commercial" group opened 2,500 BUY contracts and closed 2,700 SELL contracts. Thus, the non-commercial net position increased by 5,200 contracts over the week.
In 2025, the pound rose substantially, but it should be understood that the main reason was Donald Trump's policy. Once that driver is neutralised, the dollar may regain strength, but nobody knows when.
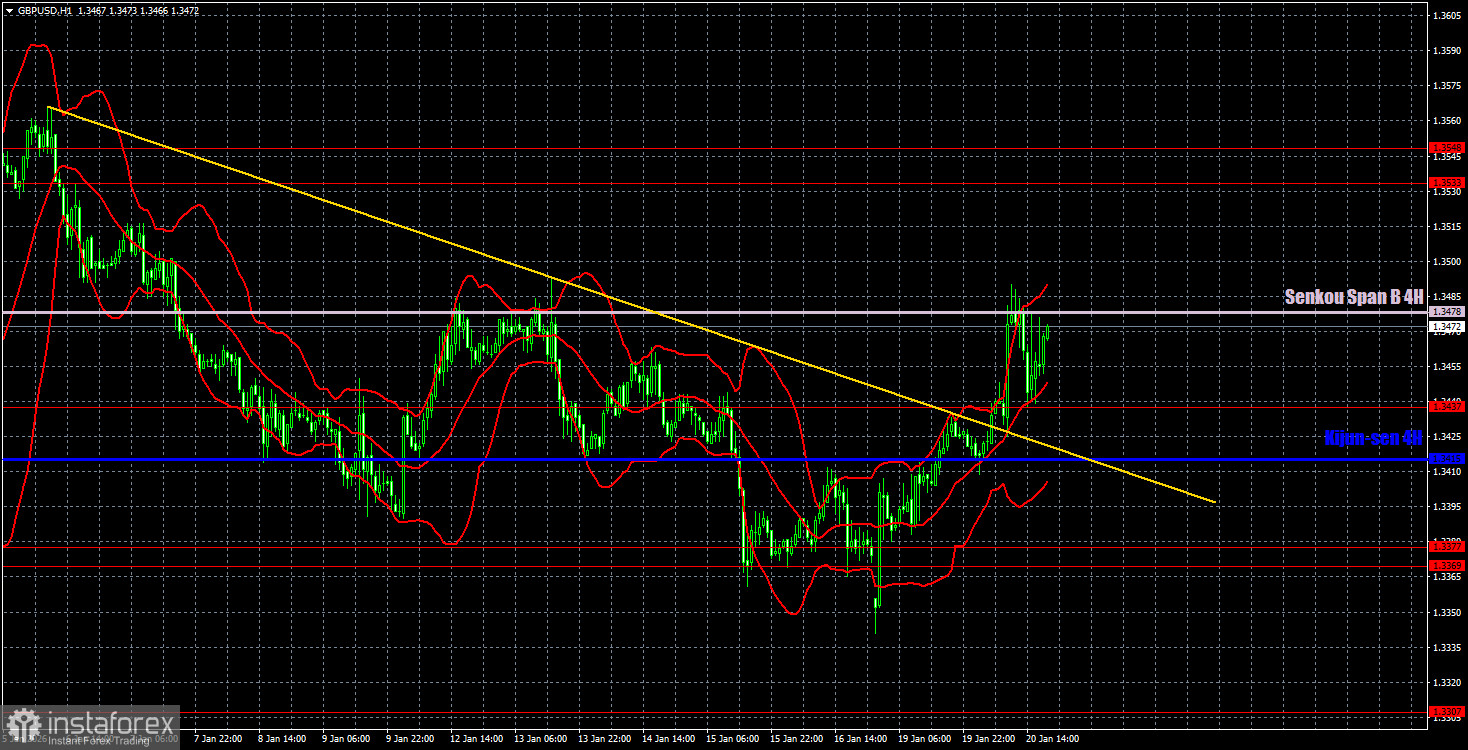
On the hourly timeframe, GBP/USD also formed an uptrend; only the Senkou Span B line remains to be overcome. If that happens, the pound will head for last year's highs. The fundamental and macroeconomic backdrop fully supports this scenario, and the market spent a full six months correcting and accumulating strength for a new northbound push.
For January 21, we highlight the following key levels: 1.3042–1.3050, 1.3096–1.3115, 1.3201–1.3212, 1.3307, 1.3369–1.3377, 1.3437, 1.3533–1.3548, 1.3615, 1.3681, 1.3763. The Senkou Span B (1.3478) and Kijun-sen (1.3415) lines can also be sources of signals. It is recommended to move the stop loss to breakeven after the price moves 20 pips in the favourable direction. Ichimoku lines may shift during the day, which should be taken into account when determining trade signals.
On Wednesday, the UK will publish the consumer price index, a fairly important indicator that strongly influences Bank of England policy. Nothing economically significant is expected in the US today, but Donald Trump is not on holiday, so a new information storm may erupt at any time.


